¶ Scope
This document is relevant to: All Duets
Firmware versions: All versions
¶ Introduction
Duet Web Control (also known as DWC) is a fully-featured browser-based user interface for the Duet family of electronics, running RepRapFirmware. DWC runs over a network connection in most modern browsers that support HTML 5, and allows configuration and control over a Duet. It is adaptive and what is displayed changes depending on the configuration of the printer connected. It is developed primarily by Christian Hammacher, and the source files are available on Github.
¶ Overview
This manual is for Duet Web Control version 2 and 3. The older version 1 is no longer supported.
¶ Main Features
- Full control of the printer connected to the Duet Electronics.
- Upload, edit and save printer configurations.
- Upload and install firmware updates.
- Upload, start and monitor prints.
- Control the connected printer through a GUI and through directly entering gcode via the console
- Errors and alerts shown as popups and in the console.
- 3D rotatable display of the bed height map.
- Upload, add and edit Macro files to automate common tasks.
- Interface an IP webcam.
- Adaptive layout that works on Large, medium and small screens (i.e PC, Tablet, Phone).
¶ Recommended versions
The general recommendation is to use the version of Duet Web Control that is released with the version of RepRapFirmware. The current supported RepRapFirmware and Duet Web Control versions are:
- RepRapFirmware 1.26.1 - DWC 1.22.6 and/or DWC 2.0.7
- RepRapFirmware 2.05.1 - DWC 1.22.6 and/or DWC 2.0.7
- RepRapFirmware 3.1.1 - DWC 3.1.1
- RepRapFirmware 3.2b2 and later - The DWC that has the same version number as the RRF & DSF release
Only the above combinations are supported. However, most Duet Web Control versions will work with most firmware versions. These other combinations are unsupported, have not been tested, some functionality may be impaired, and may cease to function with a new firmware/Duet Web Control release.
¶ Browser Compatibility
Chrome, Firefox and the Chrome-based version of Edge fully support Duet Web Control. Internet Explorer and older versions of Edge and Safari have problems, so avoid those.
Newer versions of DWC have dropped support for older browsers. Apple iOS/iPadOS versions tested recently:
iOS 10.3.3 - up to RRF/DWC 3.4.6
iOS 12.5.7, iPadOS 15.8.4 - up to RRF/DWC 3.5.4
iOS 18.4 / iPadOS 18.4 - RRF/DWC 3.6.0-rc.2 shows correctly.
Android / Chrome support will be similar, i.e. older versions won't display newer DWC versions. Generally, DWC will be supported on the last two major versions of the browser at the time of the DWC release. See this thread on the Duet3D forum for more information.
¶ Plugins
From Duet Web Control v3.2, additional functionality is available in the form of plugins. There are a number of built-in plugins (see Settings > General > Plugins) and third party plugins can be added in Setting > Machine-Specific > Plugins. As each Plugin is activated, it is added to the main menu.
¶ Adding and removing 3rd Party Plugins
Caveat: Duet3D cannot be held responsible for changes in behaviour introduced by 3rd party plugins. Proceed at your own risk! You will be reminded of the risks and responsibilities anytime you install a 3rd party plugin that's not blessed by Duet3D.
Plugins are usually distributed as zip files containing all the necessary files for the plugin to work. To add a Plugin to DWC, go to System and upload them using the Upload System Files button. After that, go to Machine Specific > External Plugins to activate it.
To remove a plugin, go to Machine-specific > External Plugins and uninstall the plugin. It's advised that you restart your machine after removing the plugin.
¶ Initial view
Note
- The Duet Web Control display is dynamic so tools, axis and other features will be displayed only if they are configured
- To help illustrate this dynamic display this manual uses screen shots from a single tool delta printer and a multi tool IDEX printer, however the descriptions are valid for any printer setup.
- Where necessary, screen shots from other configurations are also shown, and described as such.
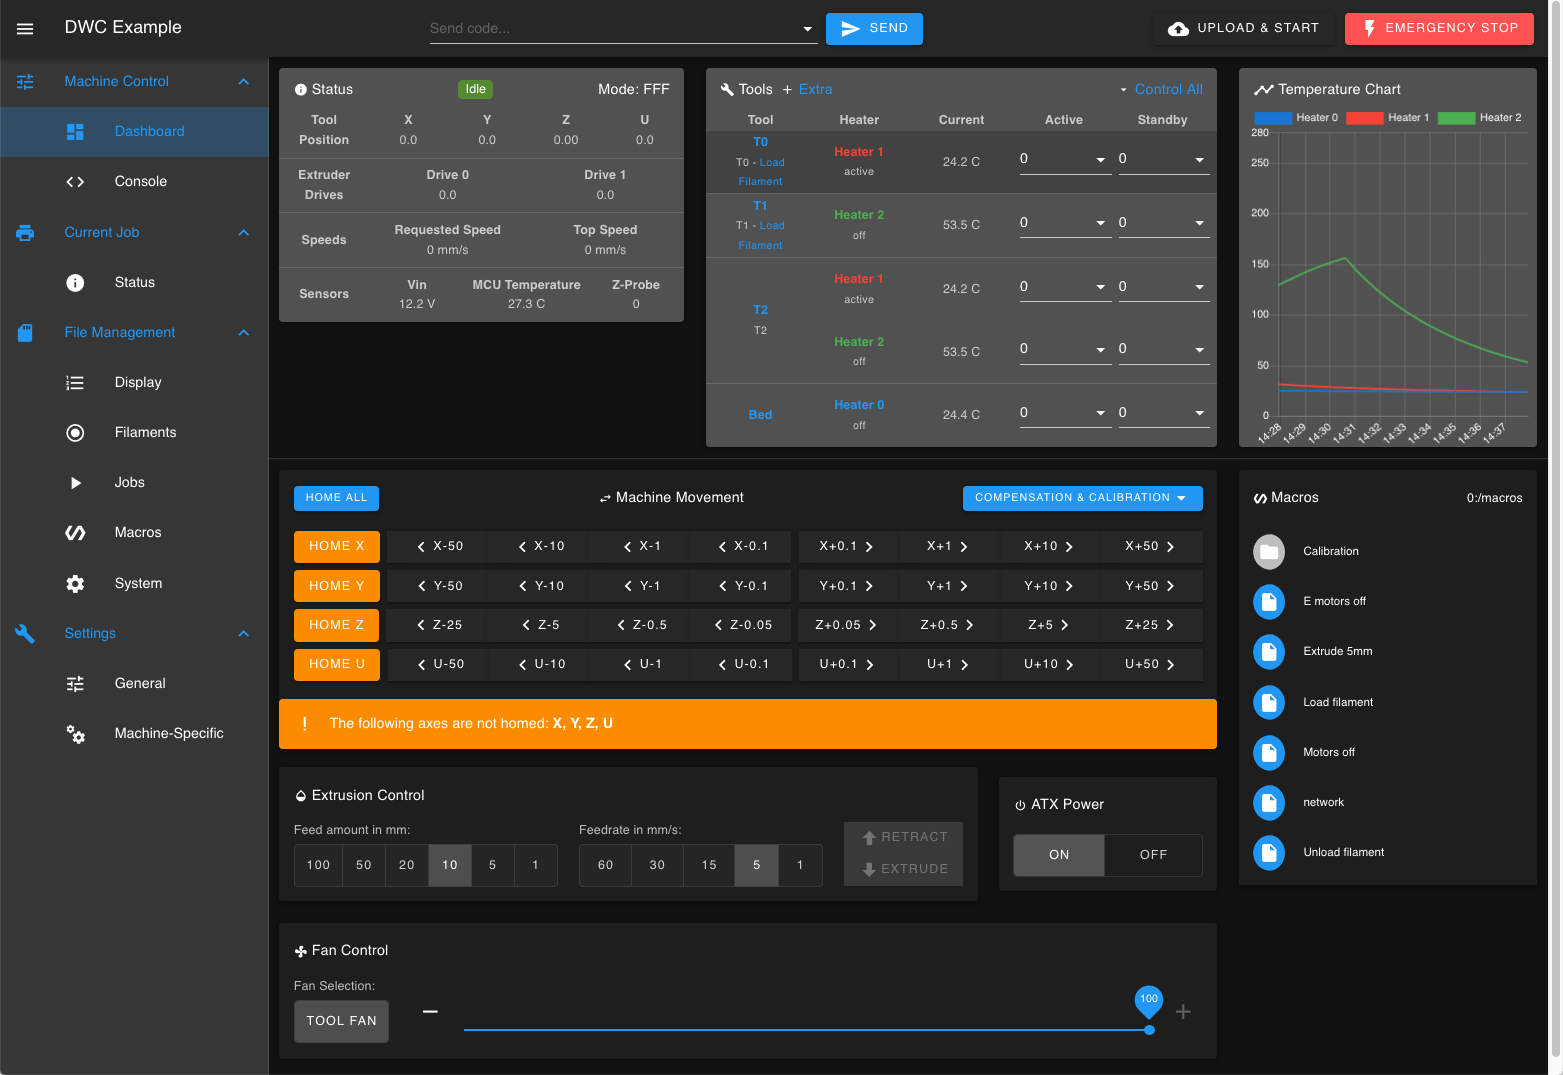
When opened in a browser Duet Web Control starts in the machine control screen, when viewed on a large screen will look similar to this:
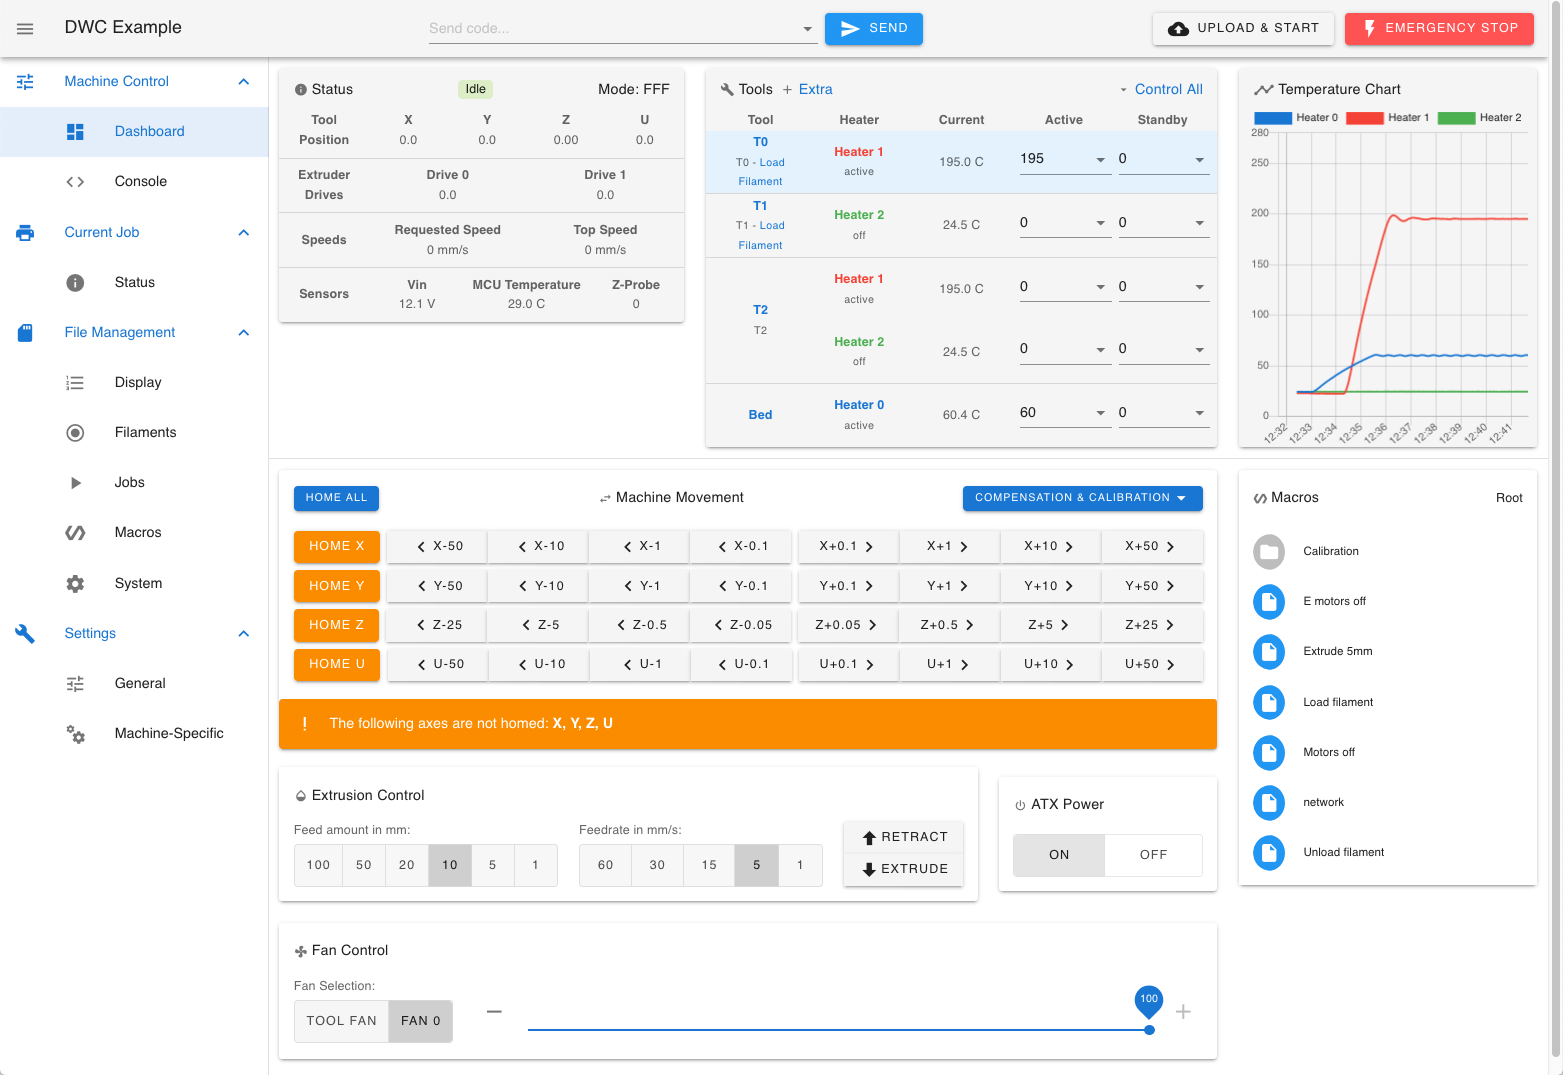
Machine Control Page for an Cartesian IDEX printer
The Duet Web Control layout will adapt to smaller screen sizes as required however all the features can still be accessed through drop down menus, as shown here on an Apple iPhone:
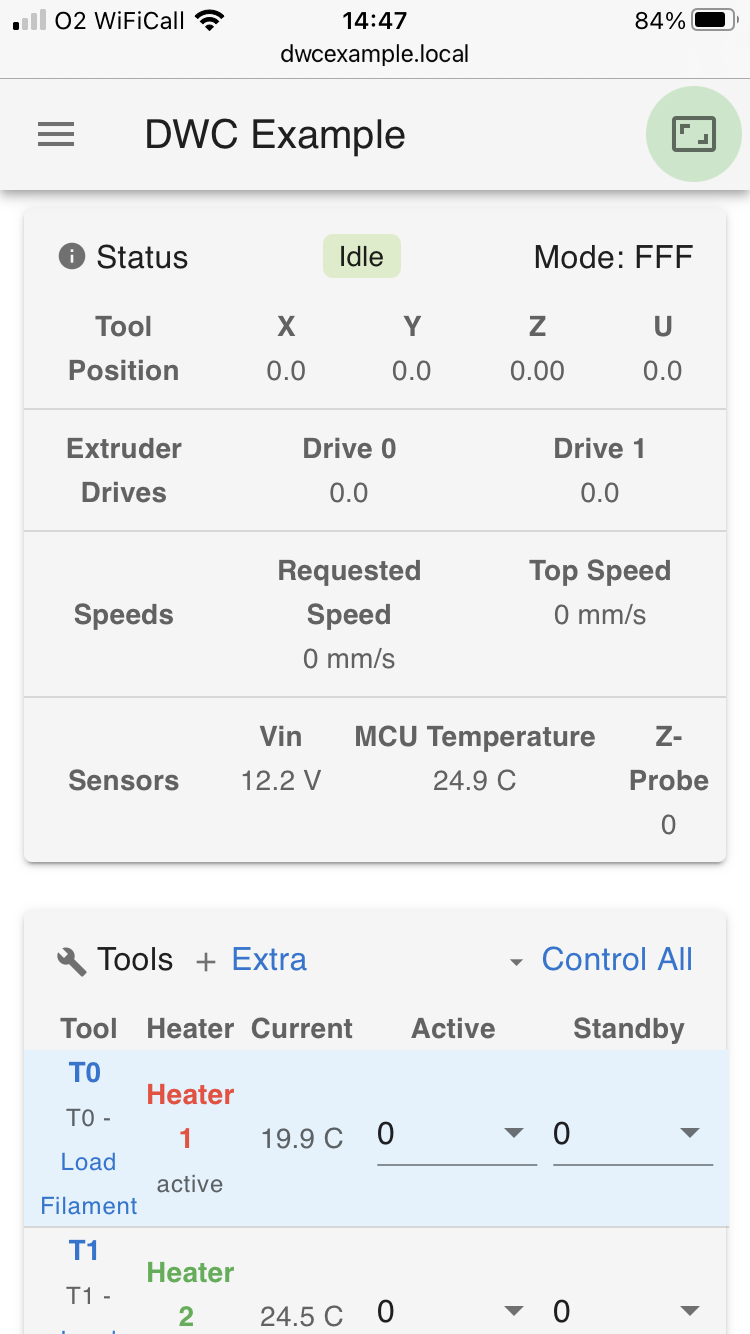
Machine Control Page for an Cartesian IDEX printer on Apple iPhone mobile phone
There is also a 'dark theme' setting, activated by selecting it in Settings > General > Appearance.

¶ Common elements
¶ Overview
Some elements of the Duet Web Control are common across all pages selected from the main menu. The header bar and main menu stay in place while the rest of the page can scroll.
¶ Header bar

The 3-horizontal-bar icon on the left hides/shows the main menu. Machine name, a quick Gcode entry box, and buttons for 'upload and print' and 'Emergency stop' are also permanently shown.
¶ Main menu
On the left side, the main menu is divided into four main groups: Machine Control, Current Job, File Management and Settings. The main menu can be hidden by clicking the 3-horizontal-bar icon on the left of the header bar.
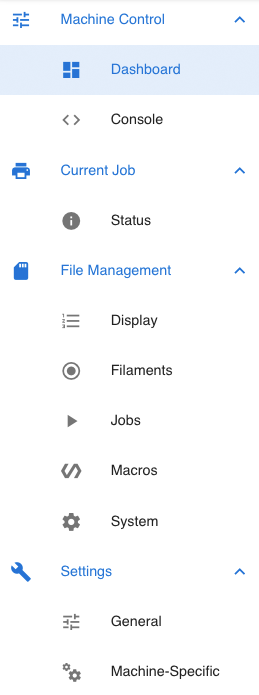
Dashboard - screen for machine control when not running a job
Console - screen for entering Gcode commands and viewing full response
Height Map - Shows the results of G29 bed mesh compensation probing. (In DWC 3.2 and later, the Height Map plug-in needs to be enabled in Settings > General > Plugins.)
Status - screen for monitoring progress of current job
Display - shows files in use for connected 12864 display (Duet 2 Maestro - DWC 2.x and later, Duet 2 Wifi/Ethernet - DWC 3.2 and later)
Filaments - screen for filament control. Filament profiles can be created, uploaded, downloaded, edited, renamed and deleted.
Jobs - List of gcode files on the SD card, with details. Files can be uploaded, run, simulated, downloaded, edited, renamed or deleted from here. Sub-directories can also be created.
Macros - List of macros. Macros can be uploaded, run, downloaded, edited, renamed or deleted from here. Sub-directories can also be created.
System - List of configuration files. Files can be uploaded, downloaded, edited, renamed or deleted from here. Sub-directories can also be created.
General - General settings. From DWC 3.2, a tab for built-in Plugins is also available.
Machine-Specific - Machine-specific settings. From DWC 3.2, a tab for third-party Plugins is also available.
¶ Printer status

The IDEX printer in this example has 3 tools defined, only defined tools are shown
The top area comprises of 3 boxed areas. On the left is the Machine Status, showing the status, machine mode (FFF/CNC/Laser), axis positions, speeds and various sensor readings.
In the middle is the Tool control. For each defined tool this shows tool and filament state, heater state, current temperature, and active and standby set temperatures. A second tab 'Extra' shows any other defined sensors.
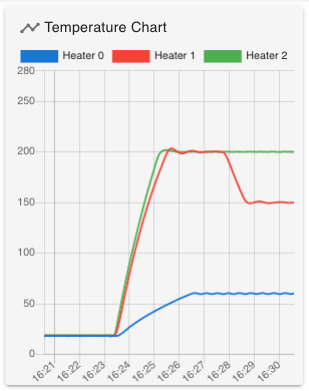
On the right is the Temperature Chart, and shows temperatures reported over time by the heaters defined in tools, and for any extra sensors selected in the Extra tab.
¶ Machine Status
This displays the machine 's current status, machine mode (FFF/CNC/Laser), current axis and extruder positions, requested and current speeds, VIN, microcontroller temperature, and Z-Probe reading.
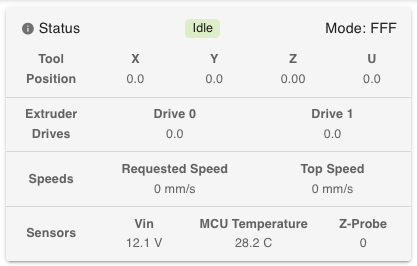
When printing the tool position and extruder drive amounts can change rapidly and the refresh rate on Duet Web Control means the values are not the exact position at all times.
The Z-Probe value is either 0 or 1000 for digital probe inputs. Analog probes can be any value between 0 and 1000.
¶ Tool control
¶ Tool States
At start up, a simple setup may show one tool and the heated bed.
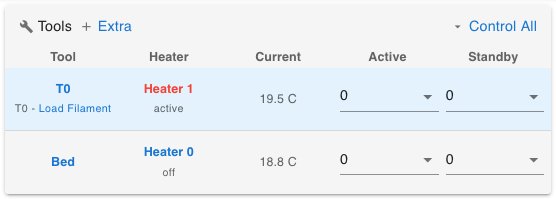
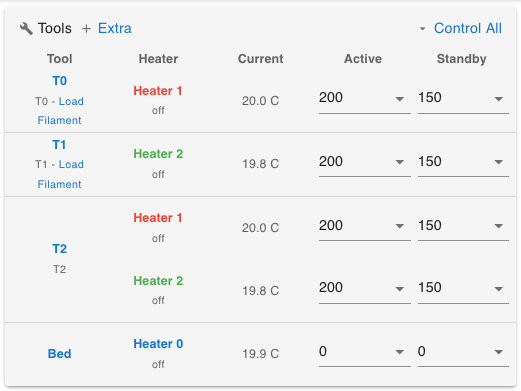
More complex setups may have multiple tools. Tools can be made up of multiple heaters, and heaters can even be shared between tools. The images below show such a setup; an IDEX (Independent X) printer with two X carriages. See Configuring RepRapFirmware for an IDEX printer for details. However, the functionality described below works across all machines with one or more defined tools.
Tools can be in three states; 'Off', 'Active' or 'Standby'. Usually, at startup, all tools are 'Off', with no tool selected, and all heaters will be 'Off'. The Active and Standby temperatures set in config.g by
G10 P[tool_number] R[Standby_temp] S[Active_Temp]
will be displayed.
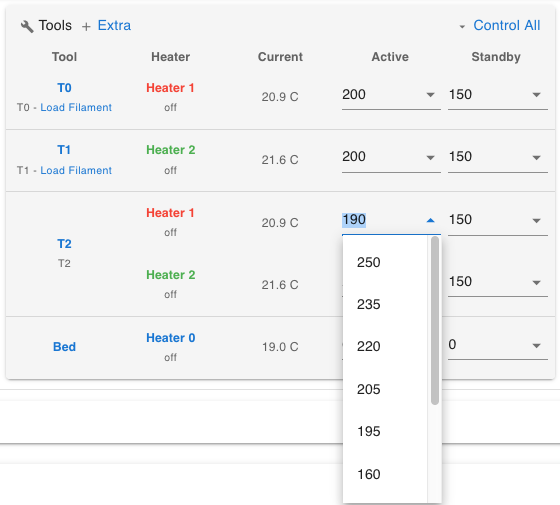
The Control All menu allows for all heaters to be turned off, as well as setting global active and standby temps:
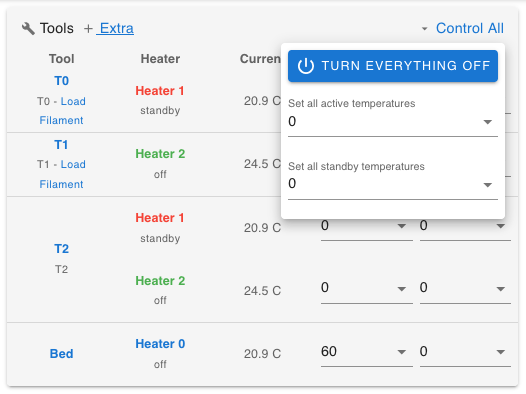
Individual heater active and standby temperatures can be input directly, or selected from the drop-down list. After typing in or selecting the temperature, press Enter to confirm. Temperatures shown in the drop-down list can be edited in Settings > Machine-Specific > Tool/Bed/Chamber temperatures.
¶ Selecting a Tool
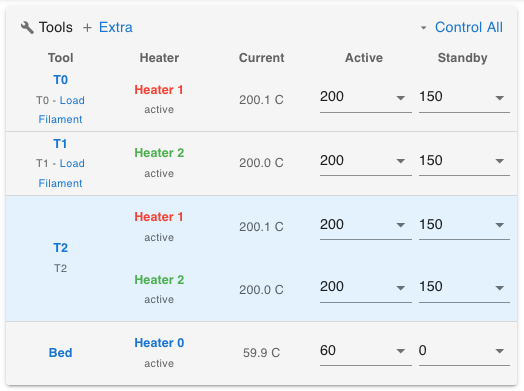
Clicking on the tool name sets the tool to 'Active'. The heater(s) of the active tool are set to the defined Active tool temperature and will heat up. Only one tool can be active at any one time, so making a tool active sets any other active tool to standby. Tools that are off will remain off.
In the image below, the 'T2' tool has been selected, which uses both heaters, which are also shared with T0 and T1, so the heaters are shown as active under T0 and T1 as well. However, only the selected tool T2 is active. The currently selected tool is highlighted in light blue in the default theme, or darker grey in the dark theme.
Clicking the active tool’s name again will set the tool to standby, and associated heaters will cool down to the set standby temperature (which can be 0C to effectively turn the heater off). The tool will no longer be highlighted.
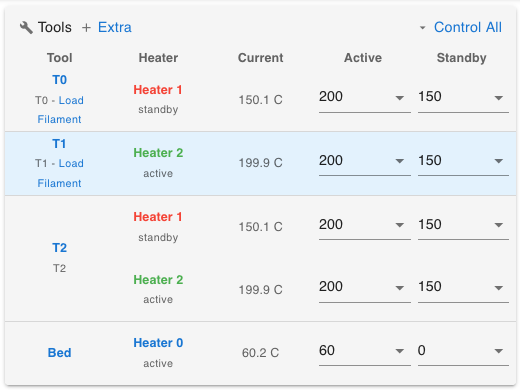
Selecting a different tool with make that tool active, and set the previous tool to standby. In the next image, tool 1 is selected so heater 2 is active, while heater 1 is at standby.
The load filament option runs a load filament macro that is defined on the filaments page which will be covered later.
Selecting a heater associated with a tool will cycle the heater (and all associated heaters) through three states: Active, Standby and Off. If you cycle the heater to ‘Off’, it will set the active and standby temperatures to 0. The associated tool will cycle between Active and Standby.
¶ Extra view
Additional sensor inputs are shown on the ‘Extra’ view. Once configured, they will show in the Extra view, with an option to display them on the Chart.

In RepRapFirmware 3.x and later, use M308 to define sensors listed in the Extra view. For example, to show the MCU and stepper driver temperature, send the following commands:
M308 S10 Y"mcu-temp" A"MCU"
M308 S11 Y"drivers" A"Steppers"
In RepRapFirmware 2.x and earlier, these are configured using M305.
¶ Temperature Chart
The temperature of each heater is displayed in the temperature chart. The colours of the lines on the chart relate to the heater colours.
¶ Dashboard
¶ Overview
The Dashboard page provides for direct machine control, and is composed of the following elements:
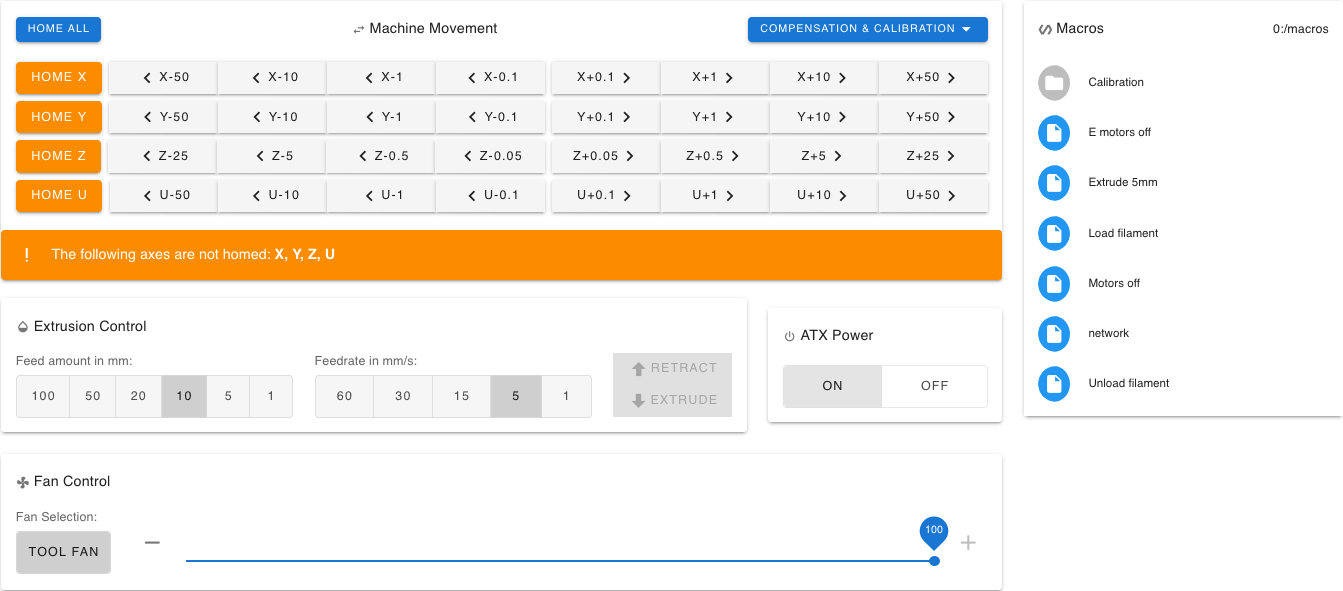
Machine Movement - Manual homing and movement controls of non-extruder axes, bed compensation and calibration
Extrusion Control - Manual controls for the currently selected tool
Fan Control - Manual control of fans
ATX Power - Not shown by default, but if activated, can be used to control PSU power
Macros - Panel allowing quick access to GCode macros
¶ Machine Movement

At the top of this section there are buttons to Home All axes, and a drop-down menu for bed compensation and calibration. On the left, there are buttons to home each axis individually, and next to these are buttons to manually control the movement of individual axes. Any additionally-defined axes beyond standard X, Y and Z will populate below these axes. Below this is a notification area that highlights if axes are not homed.
¶ Homing axes
It is best practice to ensure all axes (except extrusion axes) are homed before moving them, so each axis is set to a known position. Duet Web Control reports the homed state of the axes. The individual axes home buttons are coloured orange if the axis is not homed, along with a notification of which axes are not homed.

Clicking ‘Home All’ or one of the individual axis homing buttons will run the relevant homing macro. The Web interface uses the same GCodes to home as if the GCodes were entered manually in the console or over USB. See the section below about configuring system macros for links to more details on how this works.
Once the axes are homed, the individual axes homing buttons turn from orange to blue:

¶ Moving axes
By default, axes cannot move until they are homed. Axes can also be marked as homed if they are given a position using G92. Alternatively, the default behaviour can be overridden, and axes moved before homing, using M564.
Using the buttons for each axis, axes can be moved in large or small steps. Axes co-ordinates are shown in the machine status box:

Note that by default an axis will not be allowed to move outside of the printer dimensions set in the printer configuration file, though this can be overridden by M564. The axis movement speed is set in the Settings > Machine-Specific > General > Machine-Specific section, under “Feedrate for move buttons (mm/min)”.
¶ Adjusting movement amounts

The values of buttons to move each axis by a certain step size (e.g. 100,10,1,0.1) can be adjusted by right clicking on the button in question and entering a new value. Note that this value will be used for both positive and negative movement for that axis.
¶ Bed Compensation and Calibration
The "Compensation & Calibration" drop down menu displays the current compensation in use, and offers menu options for machine calibration and bed mesh compensation.
Machine calibration is provided by G32, and has different functions depending on machine layout. On a Cartesian/CoreXY/SCARA machine it is used for calibration.
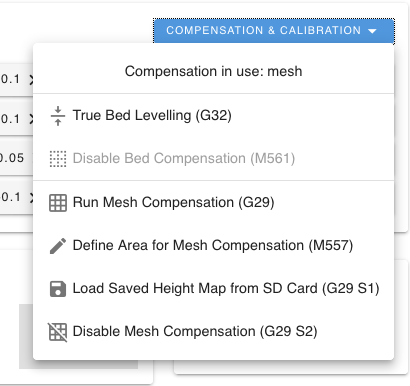
Cartesian
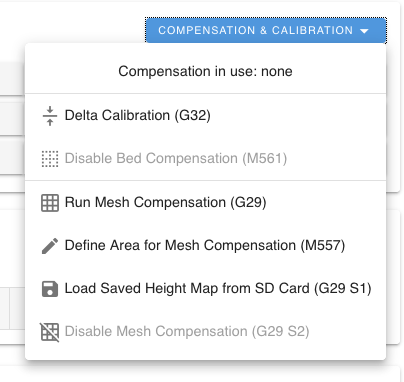
Delta
Select menu items to run calibration or disable it.
The drop down menu also gives access to the mesh bed levelling commands. Once set up correctly Mesh bed compensation probes the bed in a number of points and then uses that mesh to compensate for uneven bed surfaces. The result of running mesh compensation can be seen in the Height Map screen (see below) in the main menu.
Run Mesh Compensation (G29) - This runs the Bed Mesh Compensation. The mesh is automatically saved onto the SD card as sys/heightmap.csv.
Define Area for Mesh Compensation (M557) - Input new values for the mesh area
Load Saved Height Map from SD Card (G29 S1) - Loads heightmap.csv mesh
Disable Mesh Compensation (G29 S2) - Disables compensation
¶ Extrusion Control
Below the Axes control is the Extrusion control that allows manual extrusion or retraction of the currently active tool.

With a tool active, select the feed length and the feedrate, then click ‘Retract’ or ‘Extrude’ as required.
Note that the ‘Retract’ and ‘Extrude’ buttons will be greyed out if the temperature of the tool is below 160°C for extrusion, or 90°C for retraction. This default behaviour can be overridden; see M302.
Feed and feedrate amounts can be edited by right-clicking on the number, in a similar way to editing the axis movement buttons in the section above.
¶ Fan Control

Fan control shows the current duty cycle/speed for each fan when selected, and allows direct selection of fans and manual setting of their speed. The 'Tool fan' is the controllable fan of the currently selected tool. All Gcode/manually controlled fans should be shown. Thermostatically controlled fans are not displayed, and are not controllable.
¶ Macros
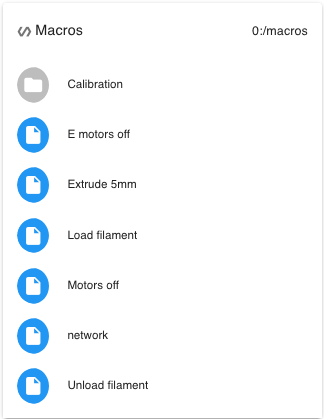
Macros menu. Subdirectories are shown at the top of the list. Click on the subdirectory to show the macros within. To run a macro simply click on the macro name.
¶ ATX Power
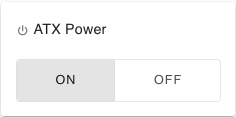
Optional control for ATX power, if it has been set up. See Power Wiring.
¶ Console
The Console provides a way of manually entering GCode commands, and displays a log of responses from the firmware or system messages since the browser was last refreshed. Responses are also shown as a pop-up, though some commands generate a response that is too long for a pop-up, so you will need to look at the Console log to see the full response. Responses in the Console log are in date/time order, with newest at the top, though this can be reversed by clicking the arrow next to ‘Date’.

The different types of response are colour coded, and are the same for the pop-up notifications. GCodes sent with no firmware response and some system messages are green. Notifications and firmware responses are blue, warnings are orange, errors are red. In the example above the red error message is from trying to move the Z axis when it was not homed, the orange warning is from loading a height map before Z is homed. GCodes entered in the console without a firmware response show in green, eg setting the microstepping with M92 X80; the green shows the command has been accepted. Querying the current microstepping setting with M92 elicits the details in blue.

Typing GCode into the box at the top of the section will show a drop-down of autocompleted and/or previously sent commands.

The console output can be cleared, or downloaded as a plain text or CSV file, from the drop down menu on the right.
Gcodes can also be entered in the quick GCode entry box at the top of the page with the output shown in the console. If the console page is not selected any output from the quick GCode entry box is also shown as a popup message. This also shows that previously entered commands in this session are shown as quick select options.
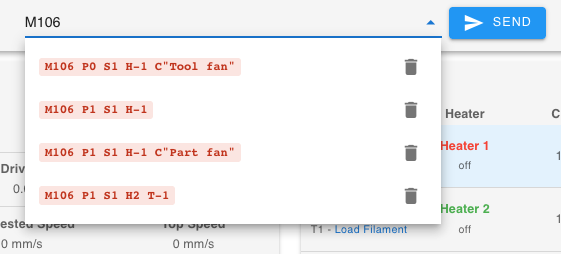
A description of all the GCodes that RepRapFirmware supports is well beyond the scope of this manual. The "?" button links to the GCode dictionary which has this detail.
¶ Height Map
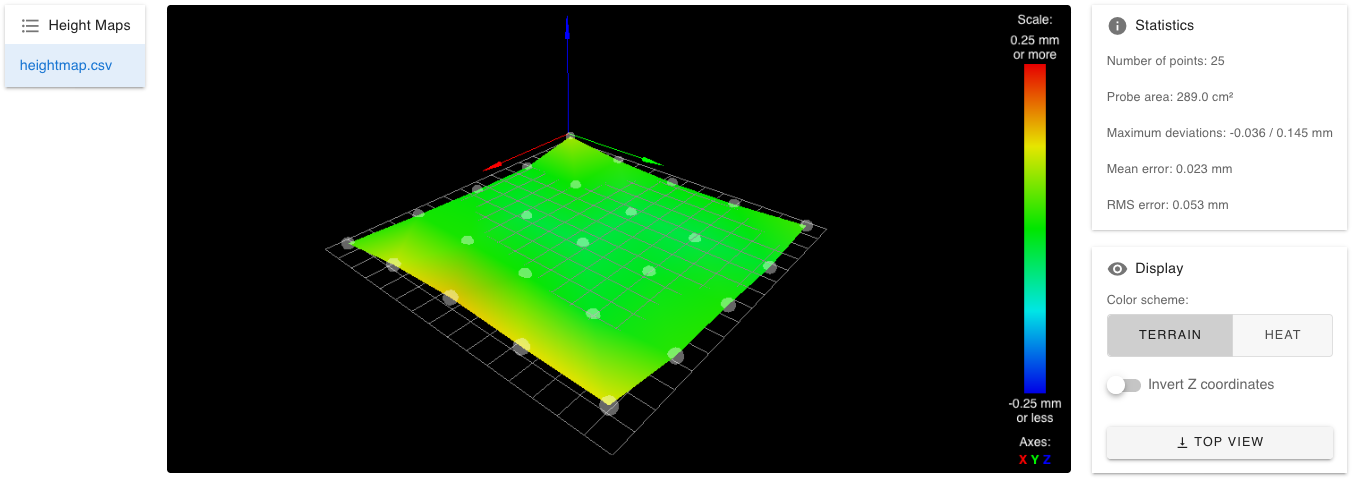
The Height Map screen displays the bed mesh compensation results. You can save multiple meshes, and display them on this screen. The view shows the statistics of the bed mesh, and some control over the display. Holding the mouse over a particular point on the mesh will show its X, Y and Z coordinates. The bed mesh can also be rotated by dragging with the mouse.
Note: In Duet Web Control 3.2 and later, the Height Map plug-in needs to be enabled in Settings > General > Plugins.
¶ Status
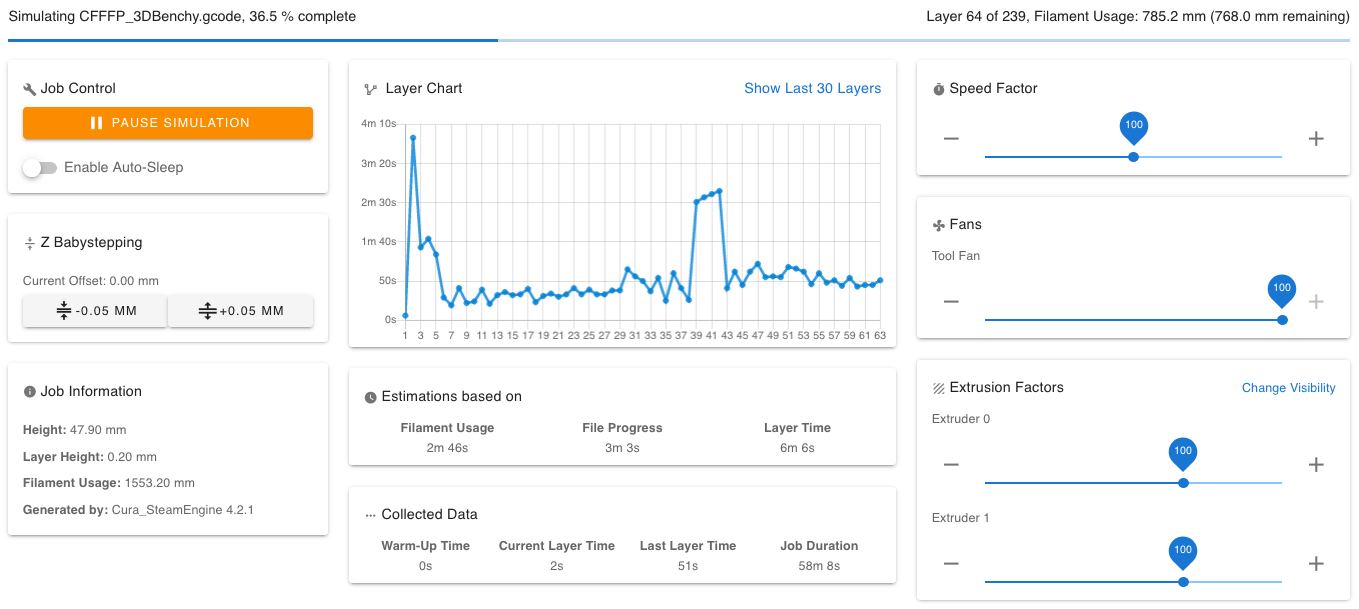
The status page does not display any useful information until a print is started. Once a print is started it shows information about the file being printed, layer times and estimates for print time remaining. It also allows for Fan, extrusion ratio and print speeds to be adjusted in real time.
¶ Print progress bar

This bar shows how far through the layers and filament the print has progressed.
¶ Job Control
The Job Control palette allows the print to be paused:
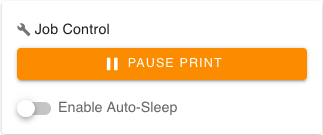
Pausing runs the "pause.g" system macro so the actions on pausing can be user configured (e.g retract some filament, move the head away from the print). Editing system macros is covered later in this manual
Once the print is paused it can be resumed or cancelled.
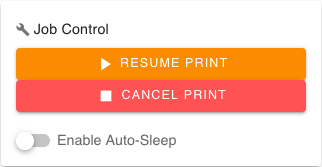
Resuming runs "resume.g", cancel "cancel.g" system macros. Once the print has finished, you can ‘Print again’ to repeat the print.
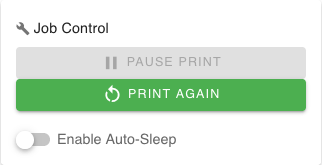
The print control section has a check box to "Enable Auto-Sleep". If this is selected then the M1 GCode is sent at the end of the print which runs the "sleep.g" macro file. This for example would allow the shutting down of the main power supply once the print has completed (assuming the printer hardware is set up to allow this).
¶ Z Babystepping
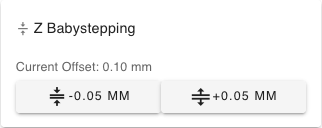
This allows for the Z axis to be lowered or raised by small steps - sometimes known as "Baby Stepping". This allows for small corrections to be made, usually to get the first layer perfect. The size of each baby step can be configured in the Machine-Specific settings covered later in this manual. See M290: Baby stepping.
¶ Job information
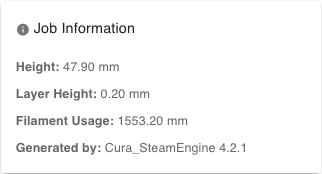
This reports information from the file header that is provided by the slicer The reported information is reliant on the slicer placing the correct information at the end of the GCode file in a format the Duet Web Control understands. Newer versions of the following slicers are reported to provide this information:
- Simplify3d (v4 and later)
- Slic3r (1.29 and later, Slic3r PE)
- PrusaSlicer
- Kisslicer (Pro)
- Cura (2.7 and later)
- IdeaMaker
- Canvas
- Matter Control
¶ Layer Chart
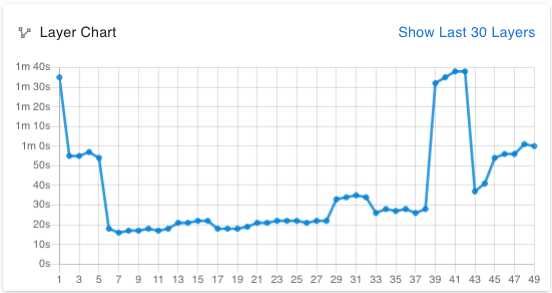
As the print progresses data is collected and displayed in the chart, showing the time taken (Y axis) for each layer (x axis). View either all layers, or the last 30 layers.
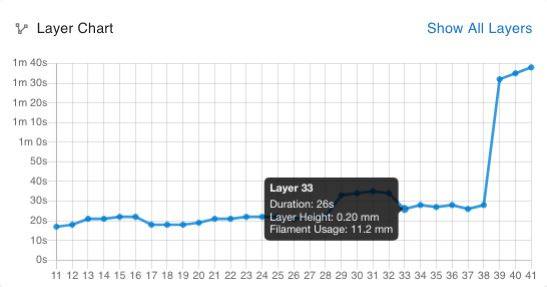
Hovering over a point in the chart will provide more information about that layer.
¶ Print progress estimations

Duet Web Control displays a number of estimations of print progress: filament usage, file progress, layer time, the time estimated by the slicer, and the Simulation time. The Filament Usage and Layer Time estimates rely on the GCode file having sufficient header information provided by the slicer (see the Job Information section earlier in this manual). Different print jobs will have different properties so the accuracy of each estimation varies by the print job. Simulating the print can provide a more accurate estimation. See the section on simulation later in this manual.
¶ Collected Data

Shows statistics for the current print. Warm up time is the amount of time before the print actually starts. This particular print was started with the nozzle and bed warm so no warm up time was registered.
¶ Speed Factor

This shows the setting for, and allows the override of, the print speed factor. This scales all feed rates so should be used with caution.
¶ Fan Control
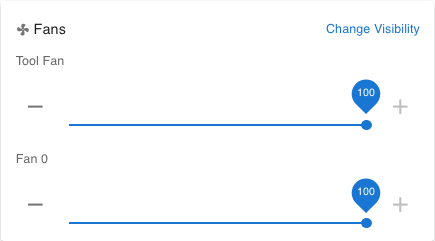
Shows the current duty cycle/speed for each fan, and allows direct selection of fans and manual setting of their speed. The 'Tool fan' is the controllable fan of the currently selected tool. All Gcode/manually controlled fans should be shown. Thermostatically controlled fans are not shown, and are not controllable. Click ‘Change Visibity’ to show/hide fans.
¶ Extrusion Factors

This shows the setting for, and allows the override of, the extrusion factor (M221), per extruder. Click ‘Change Visibility’ to show other Extruders as well as the one currently in use.
¶ Display
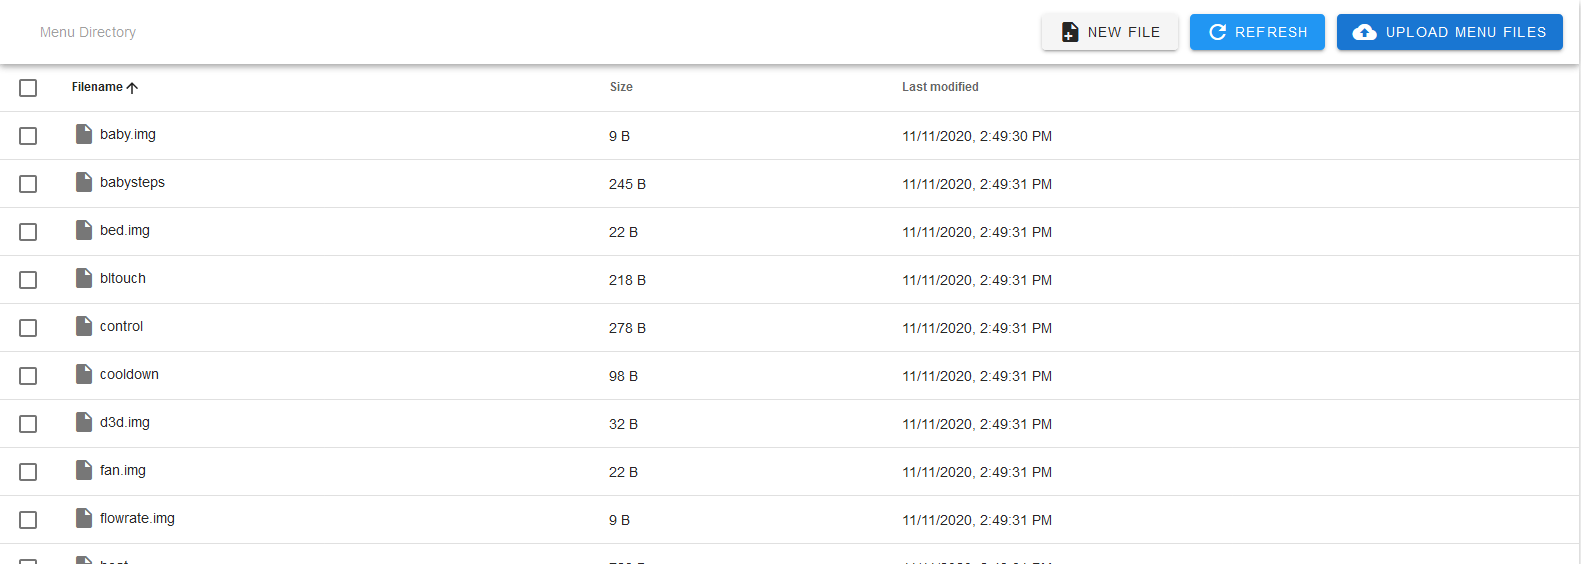
Shows the files for a connected 12864 display, if enabled. See Connecting a 12864 display for more details.
¶ Filaments

The filaments page allows for the configuration of filament types and their associated load and unload macros. See the Filaments documentation for more information.
Use the buttons on the top bar to create a new filament, refresh the list or upload a filament configuration. Click the filament name to see and edit the filament config.g, load.g, unload.g. Right click the filament name to download the filament configuration as a ZIP, rename it, or delete it.
¶ Jobs
The Jobs page allows for GCode files to be run, simulated, uploaded, downloaded, edited, renamed, deleted and organised. A summary of the print time and other information is shown if the slicing software adds it to the header (see the Job information section of this manual above). As shown in the image, there is a drop down menu to select the external SD card if one is connected to the Duet.

The header bar shows which SD card in use, the directory path of the file list displayed, and buttons to create new directories, refresh the current file list, and to upload GCode files.
¶ Uploading and organizing GCode files
GCode files can be uploaded by clicking the ‘Upload GCode File(s)’ button and browsing your computer for them, or by dropping files from your file manager onto the ‘Upload GCode Files(s)’ button. Additionally, some slicer software can be set up to send files directly to the Duet. You can also use the ‘Upload and Start’ button in the header bar to quickly upload and start a print.
It is recommended that file uploads are not used during a print to prevent interference with reading the SD card for an ongoing print, or possible corruption of the uploaded file. A blue notification pop-up shows the upload progress.
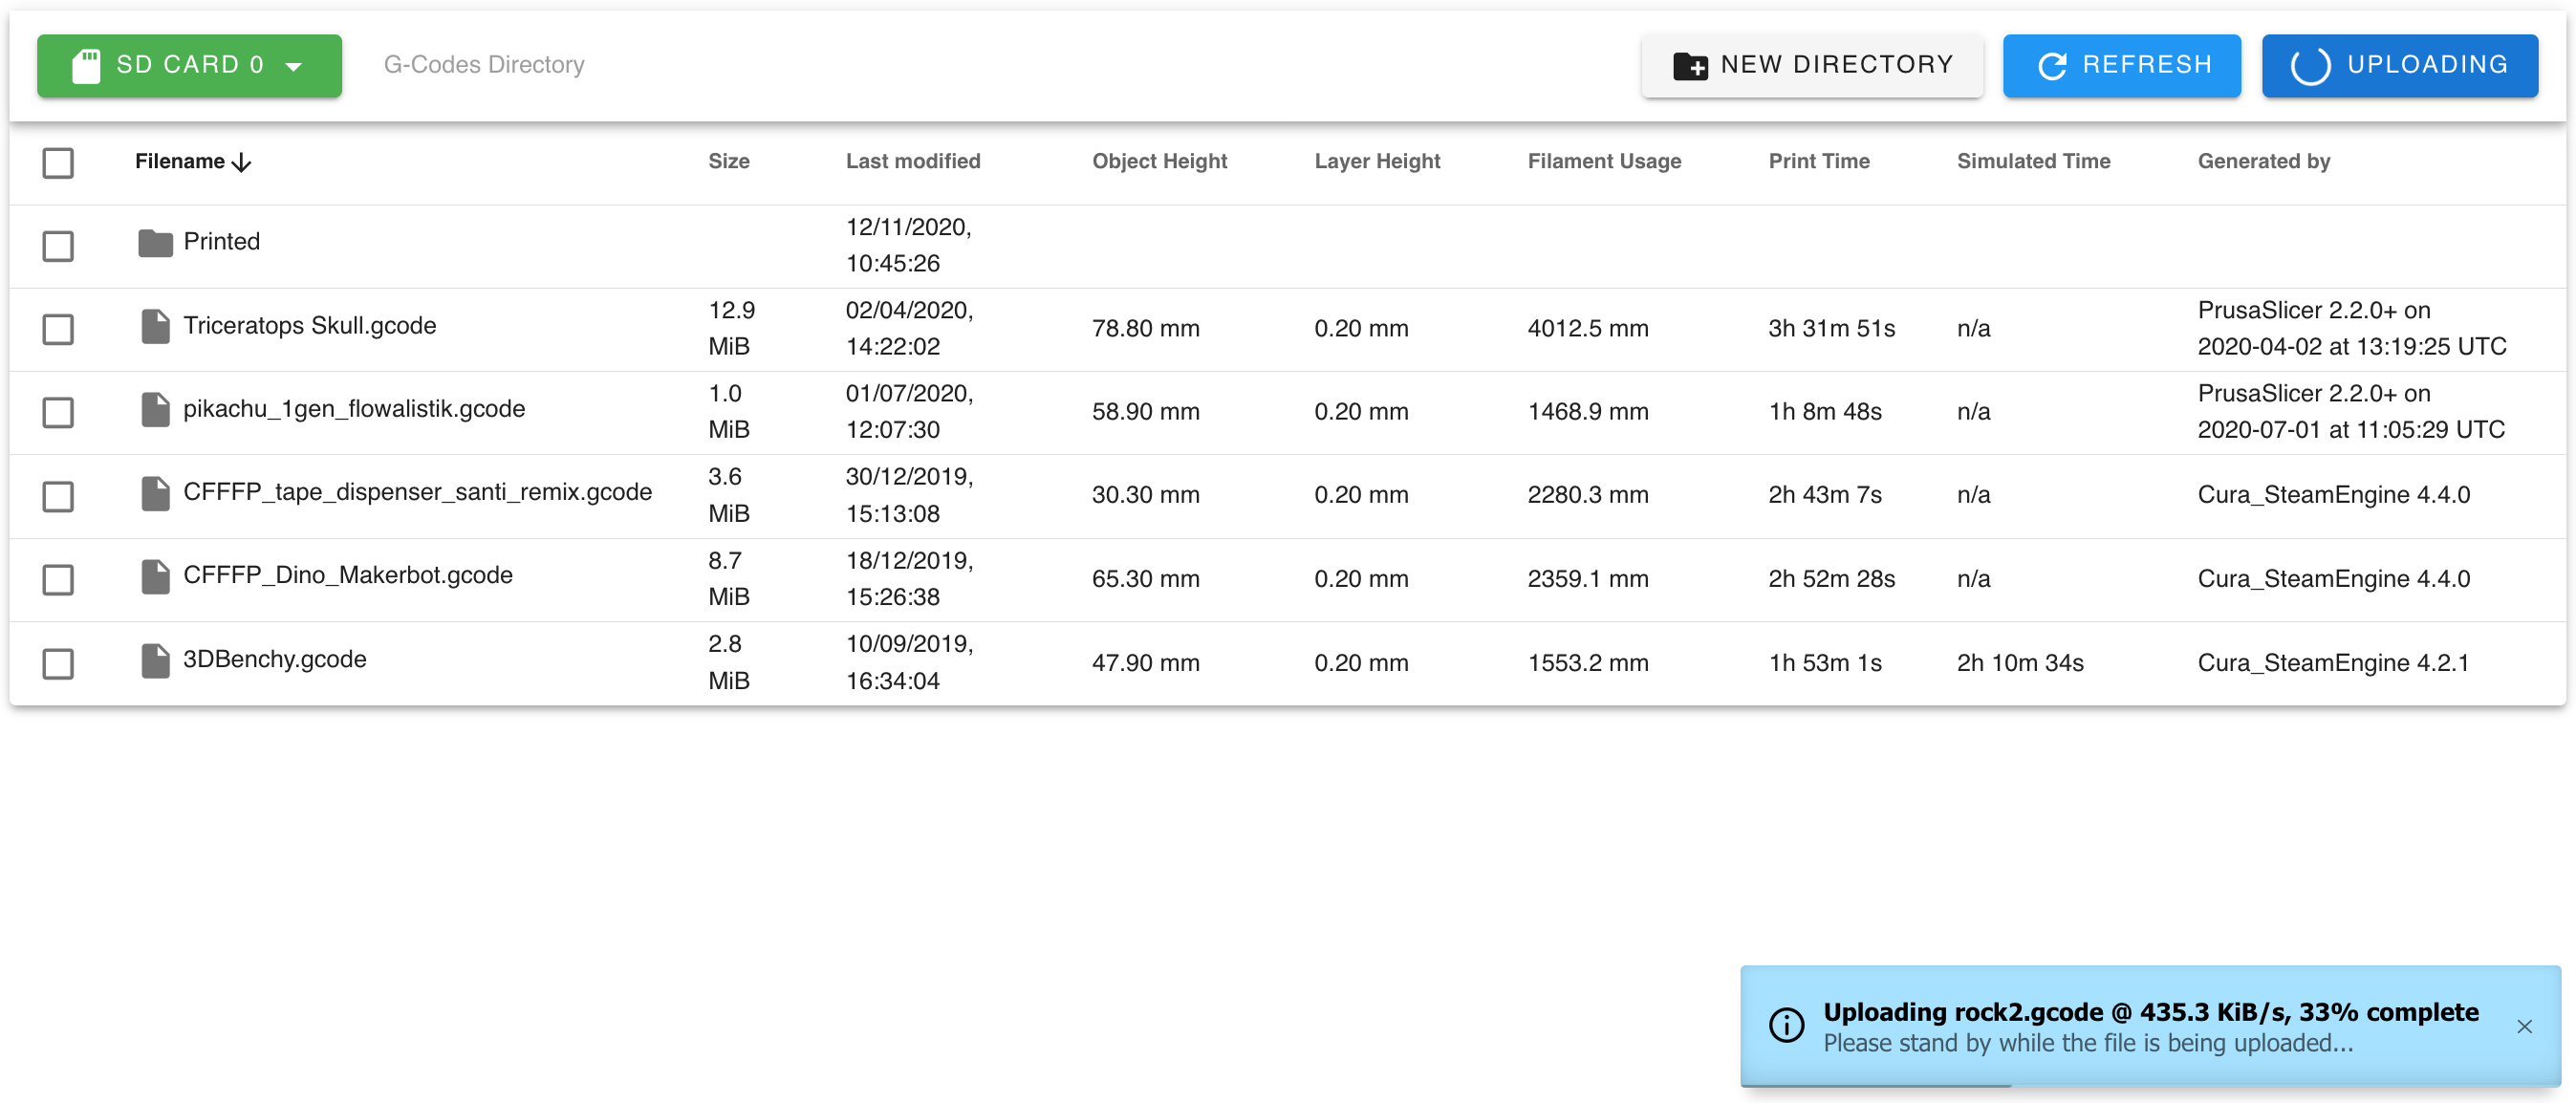
Subdirectories are created by clicking the ‘New Directory’ button, then naming the directory. Files can be dragged and dropped into subdirectories for organisation. To move a file out of a subdirectory, drag it to the directory path in the header.
The file list can be sorted by clicking on the relevant column heading. A second click will reverse the direction.
¶ File menu
Clicking on a GCode file in the file list will pop up a dialogue box to run the GCode file selected. You can also use the upload and print button in the header bar to quickly start a print.

Right clicking on the file opens a menu with options to run file, simulate, download, edit rename or delete the file.
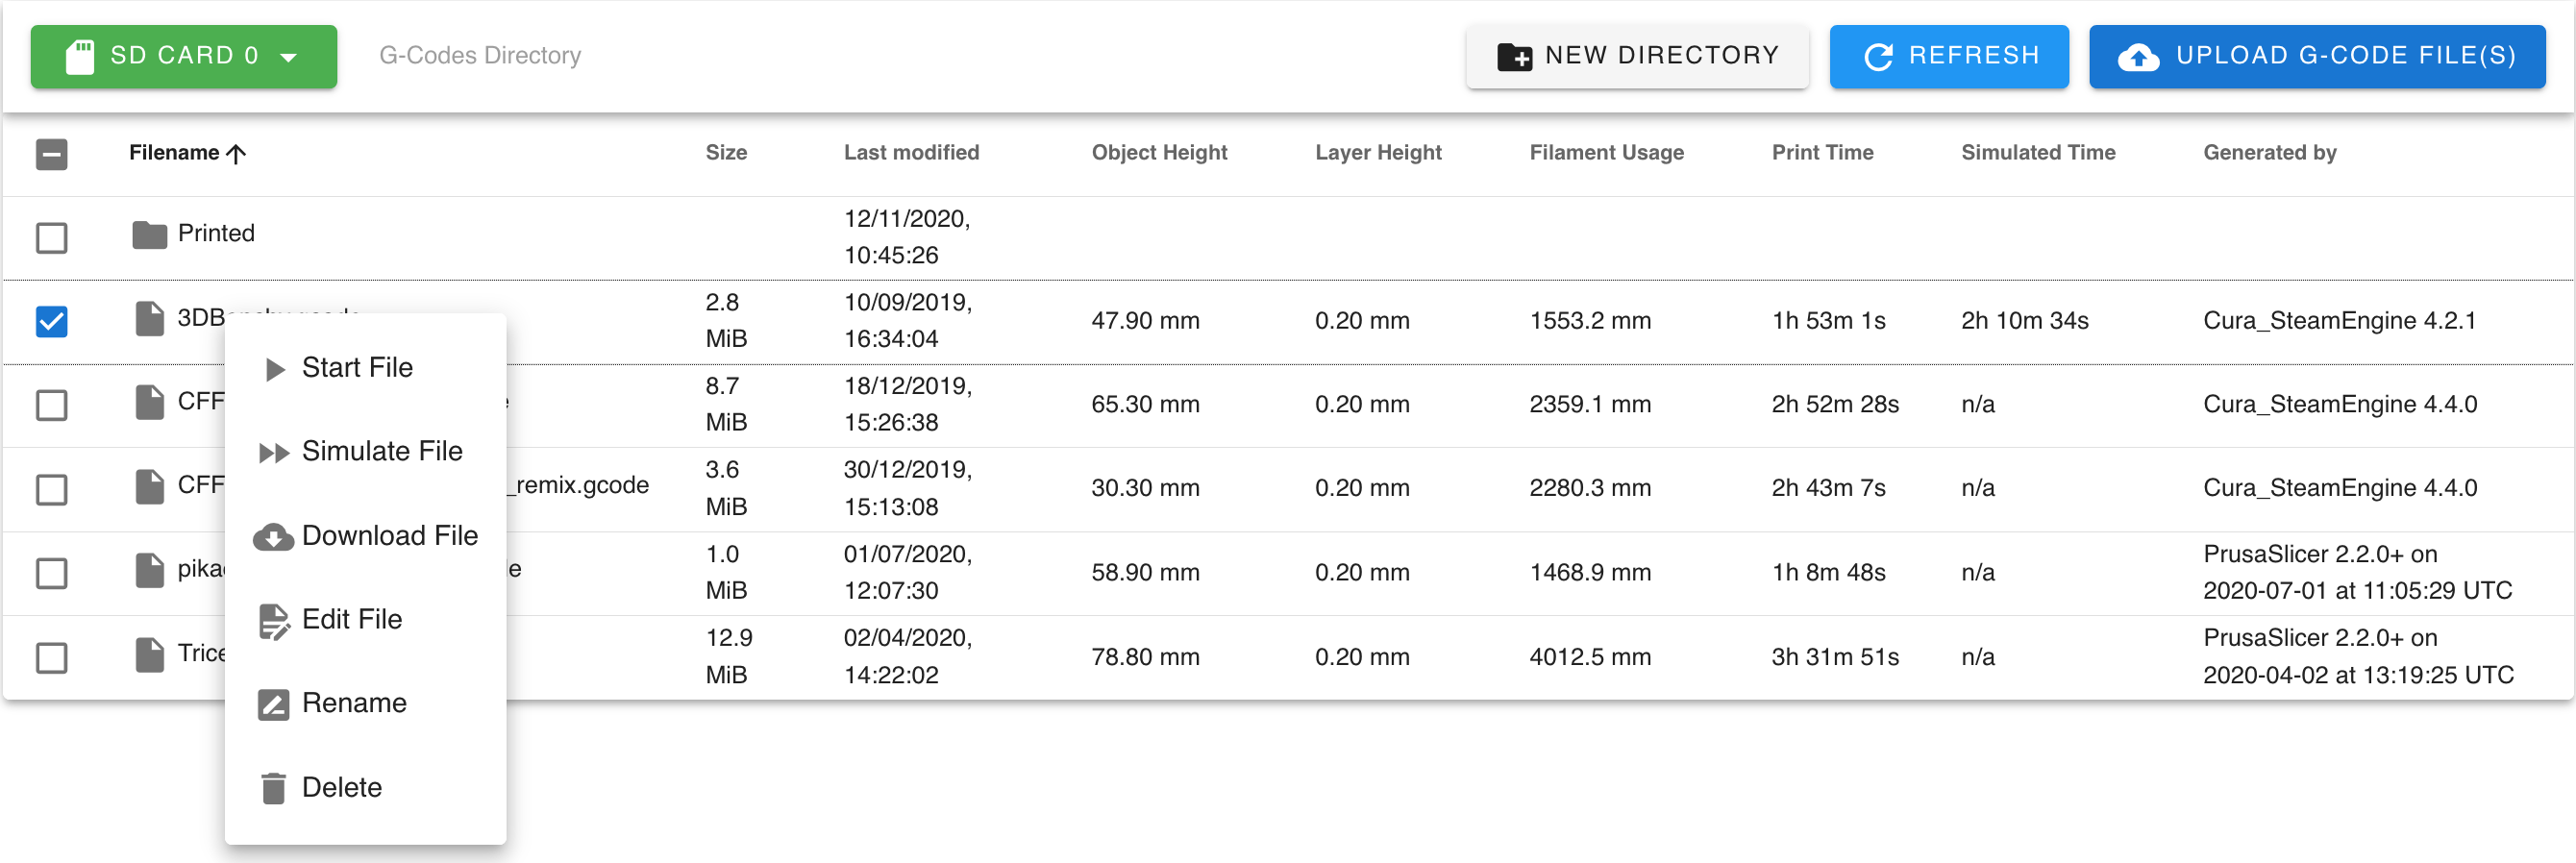
A couple of these options warrant further explanation.
¶ Start File
Selecting ‘Start File’ from the right click menu runs the file immediately; it does not prompt before starting.
¶ Simulate File
The ‘Simulate File’ option runs the file without heating any heaters or moving any axis. The firmware works out how long moves take and thus can determine an accurate estimate of the print time. When started, the screen switches to the ‘Status’ screen to show the simulation progress. Simulations run much faster than real prints, typically taking a couple of minutes per megabyte of GCode. Simulations can be paused and cancelled from this screen.
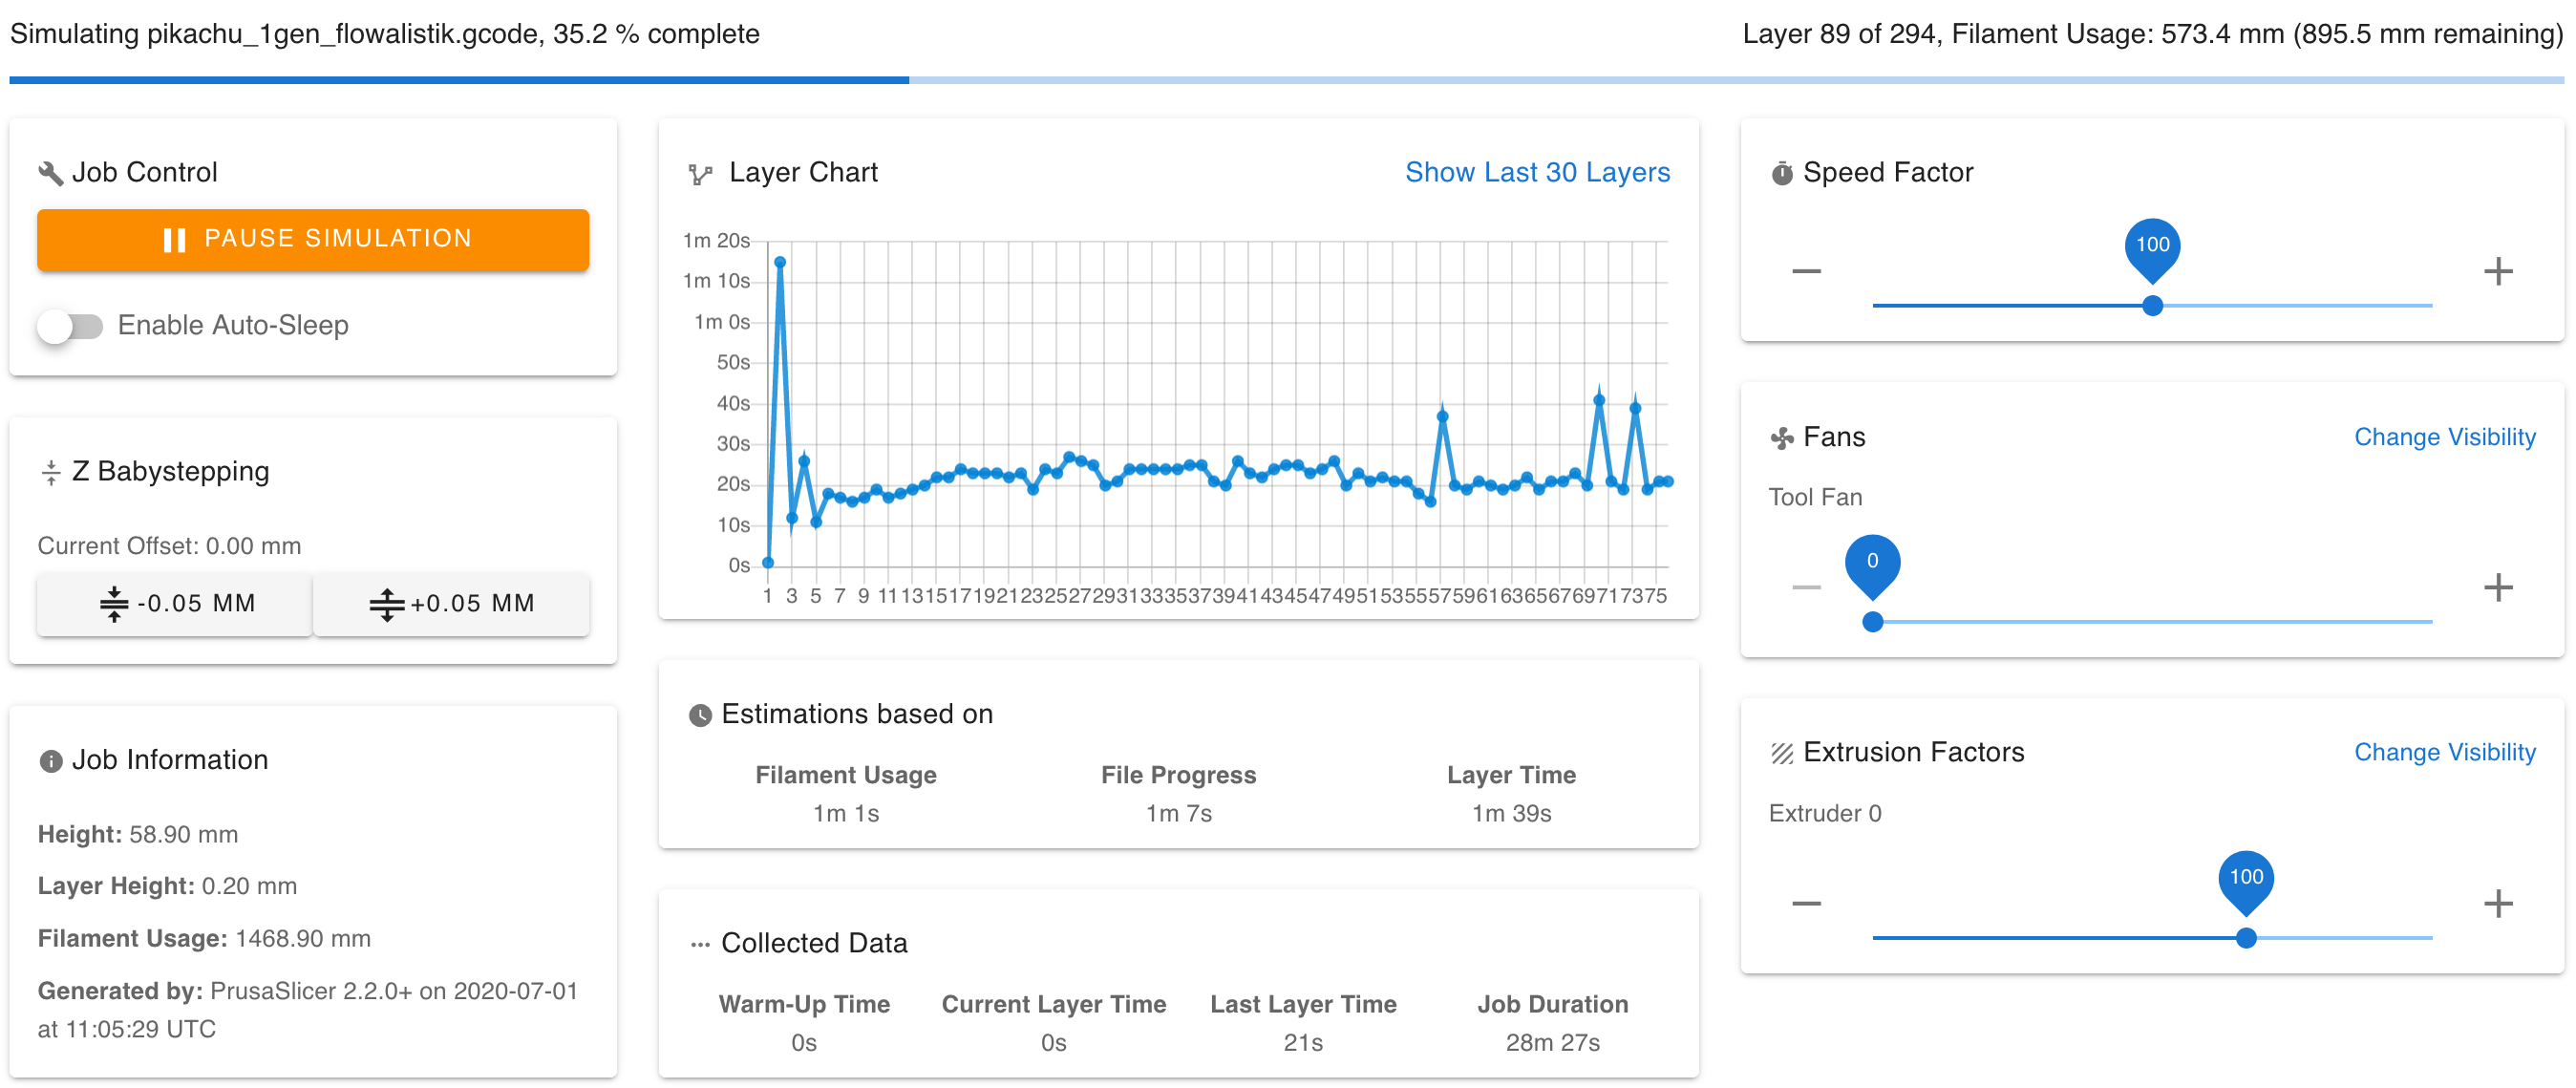
The results are reported as a pop up and in the console.

And added to the file list view on the ‘Jobs’ screen, in the 'Simulated Time' column.

¶ Edit File
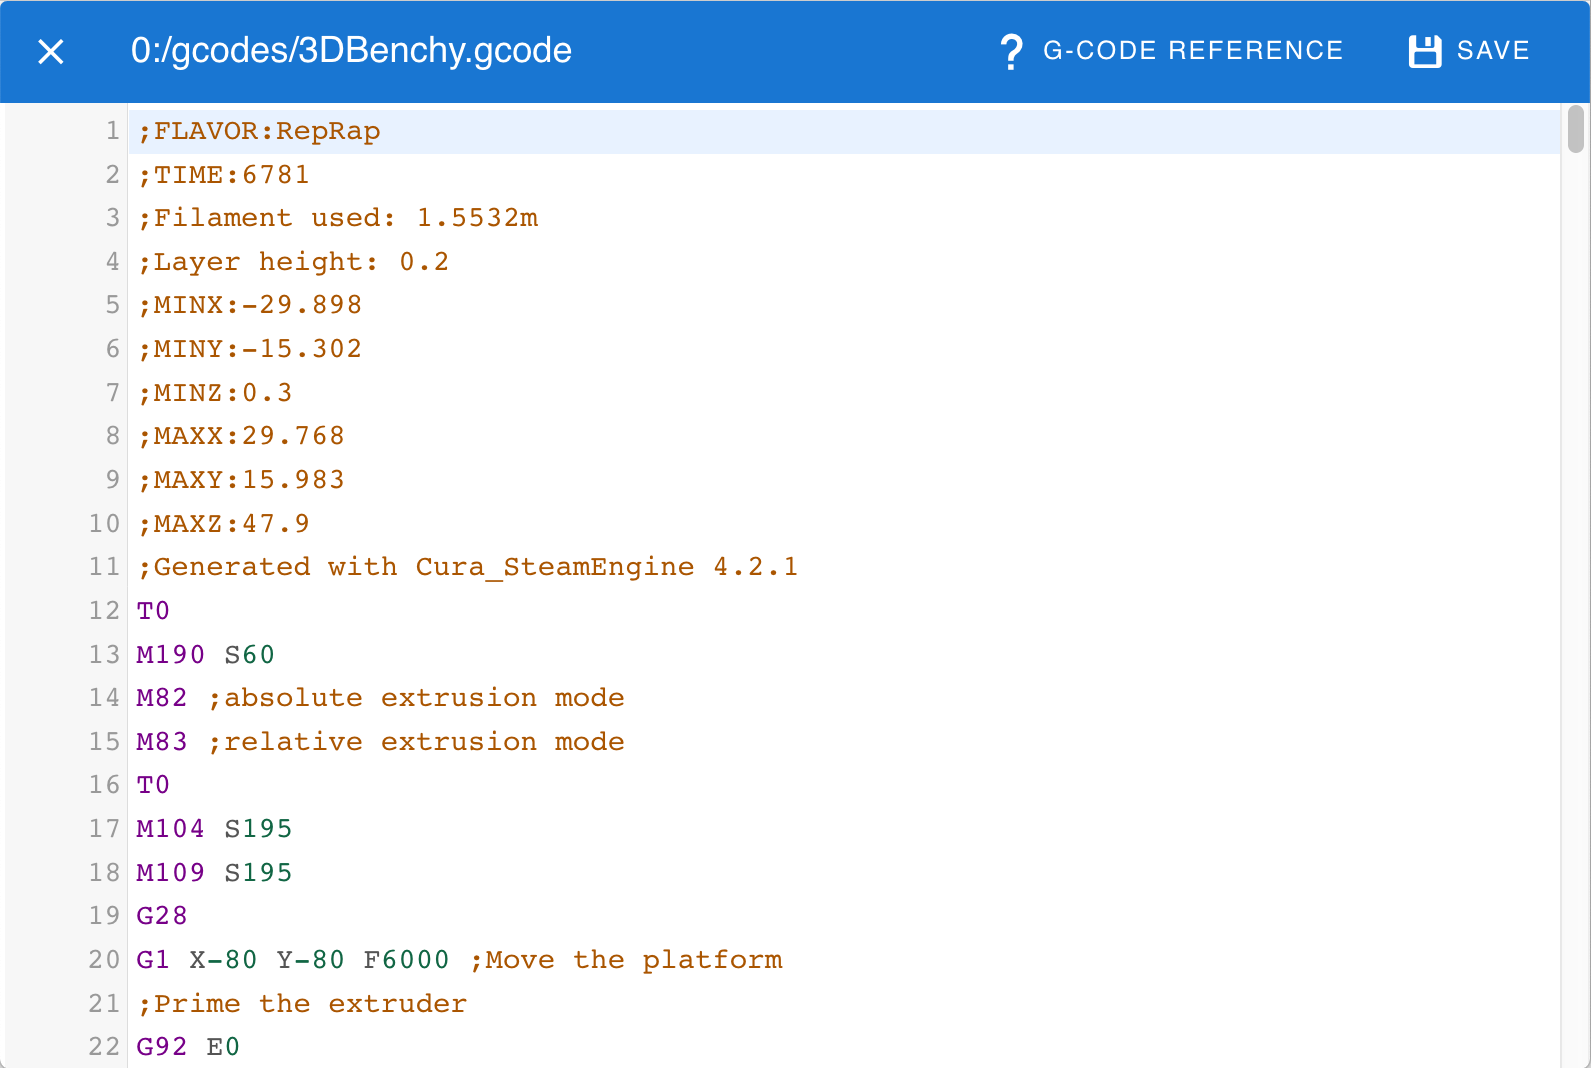
In order to edit a file, the file needs to be downloaded from the SD card into your browser’s local cache. This can take a while, especially for large GCode files. Editing allows for quickly changing settings such as the start print temperature. More complex editing is best done by downloading the file, using an offline editor and re-uploading it.
¶ Macros
Macros are a powerful addition to RepRapFirmware and Duet Web Control as they allow automation of any process that can be described in Gcodes. There are two general types of macros: system macros which will be described later, and user macros which are described here. For more information and examples of macro usage, see the Macros documentation page.
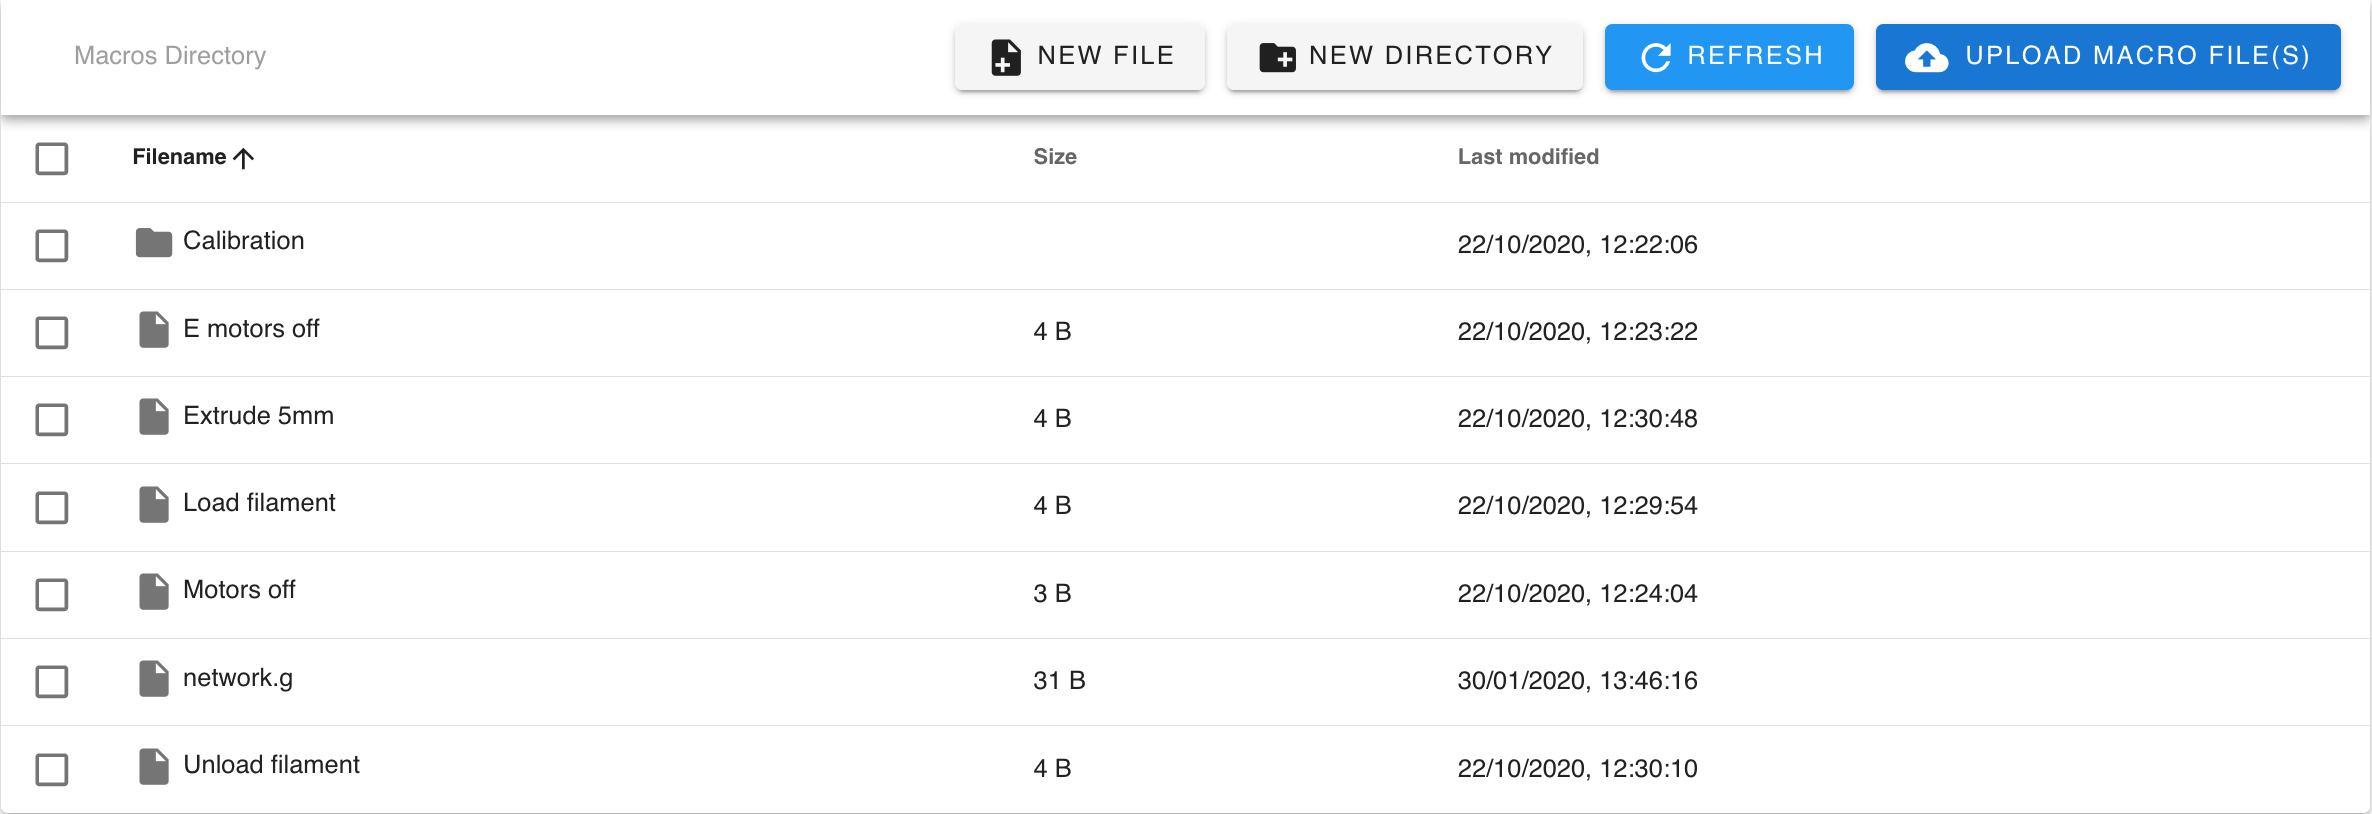
The Macro screen shows a list of all the user macros that are stored in the /macros/ directory. Blank macro files can be created by clicking ‘New File’, or existing macros uploaded using ‘Upload Macro File(s)’. New sub-directories can be created with the ‘New Directory’ button. Macros can be organised into sub-directories and dragged and dropped between them. Right-clicking on a sub-directory name allows for renaming or deletion of the directory.
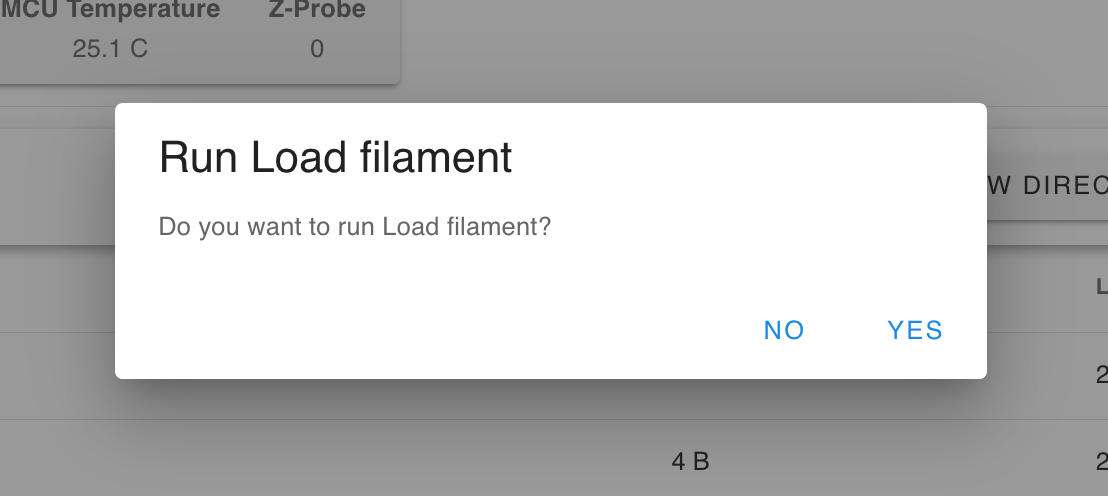
Clicking on a macro will display a confirmation dialogue box, confirming that you want to run the selected macro.
Right-clicking on a Macro displays a menu of options.
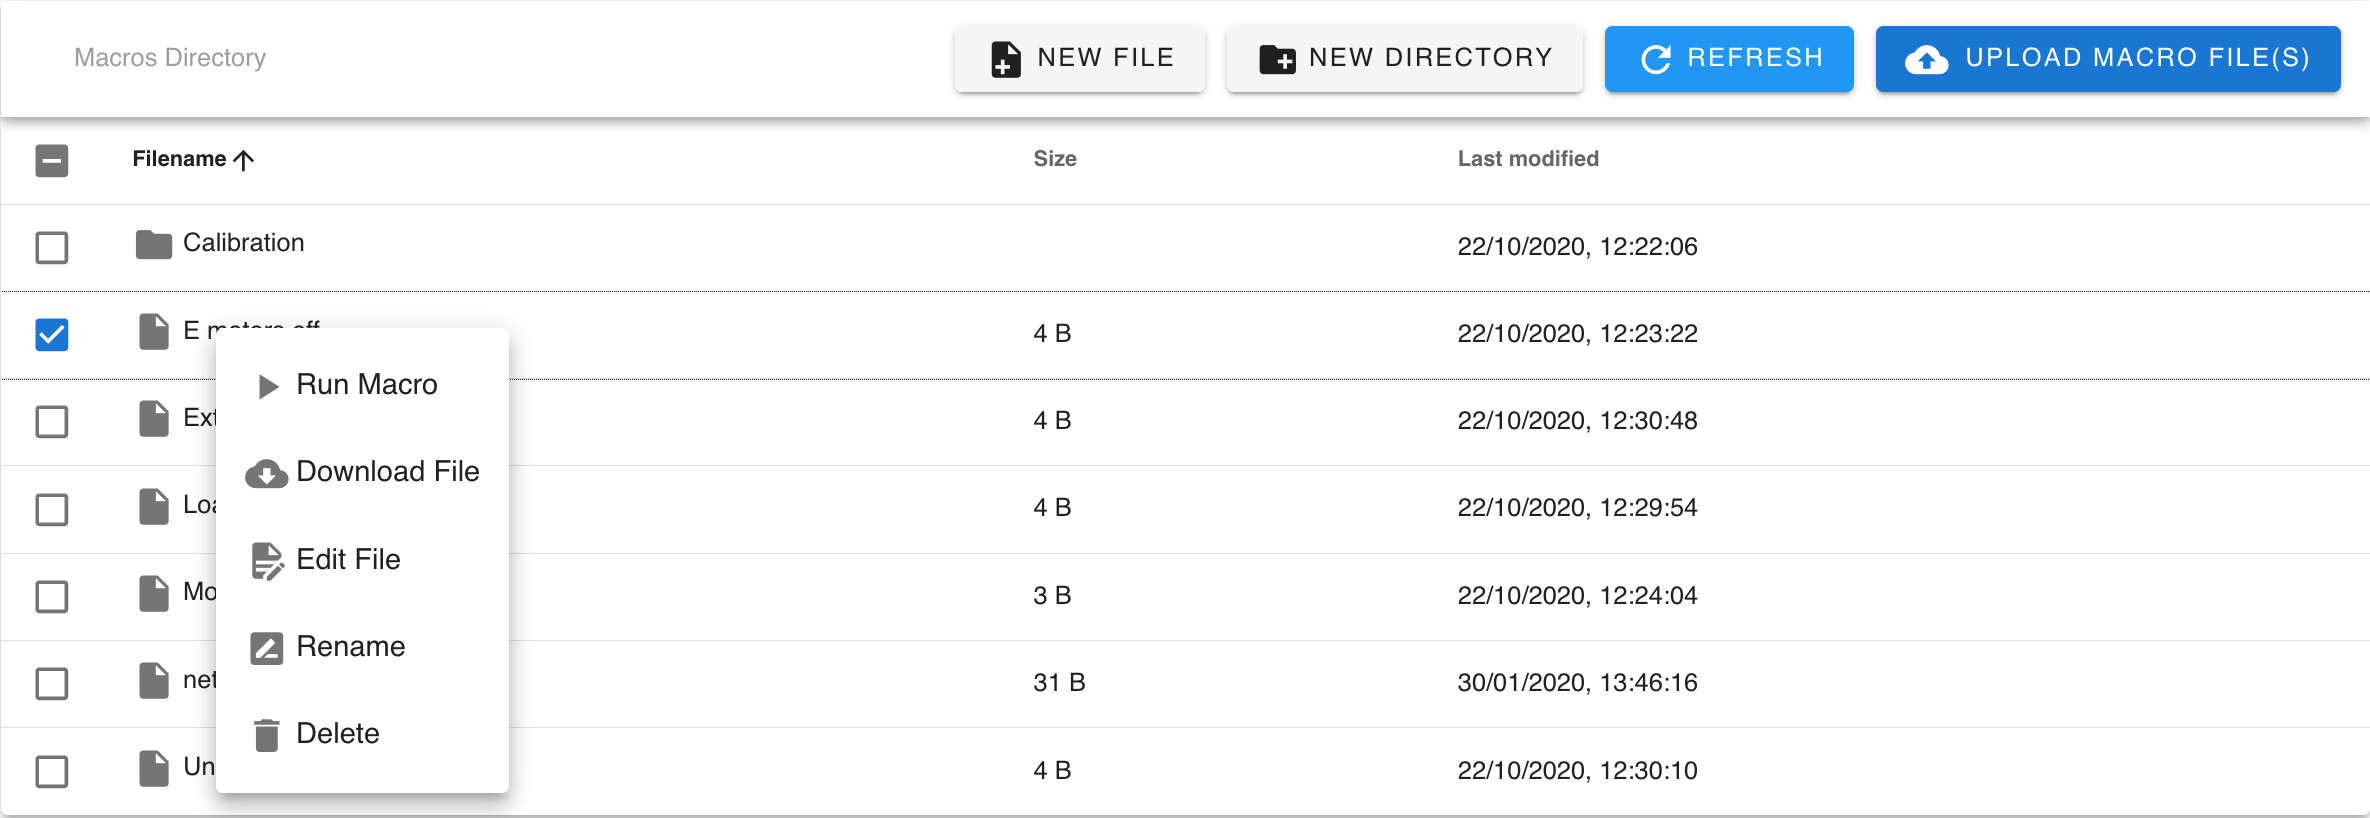
‘Run Macro’ will run the selected macro immediately, without the confirmation dialogue box. ‘Download File’, ‘Rename’ and ‘Delete’ are self-explanatory.
‘Edit File’ allows for editing the macro file within Duet Web Control in the browser:
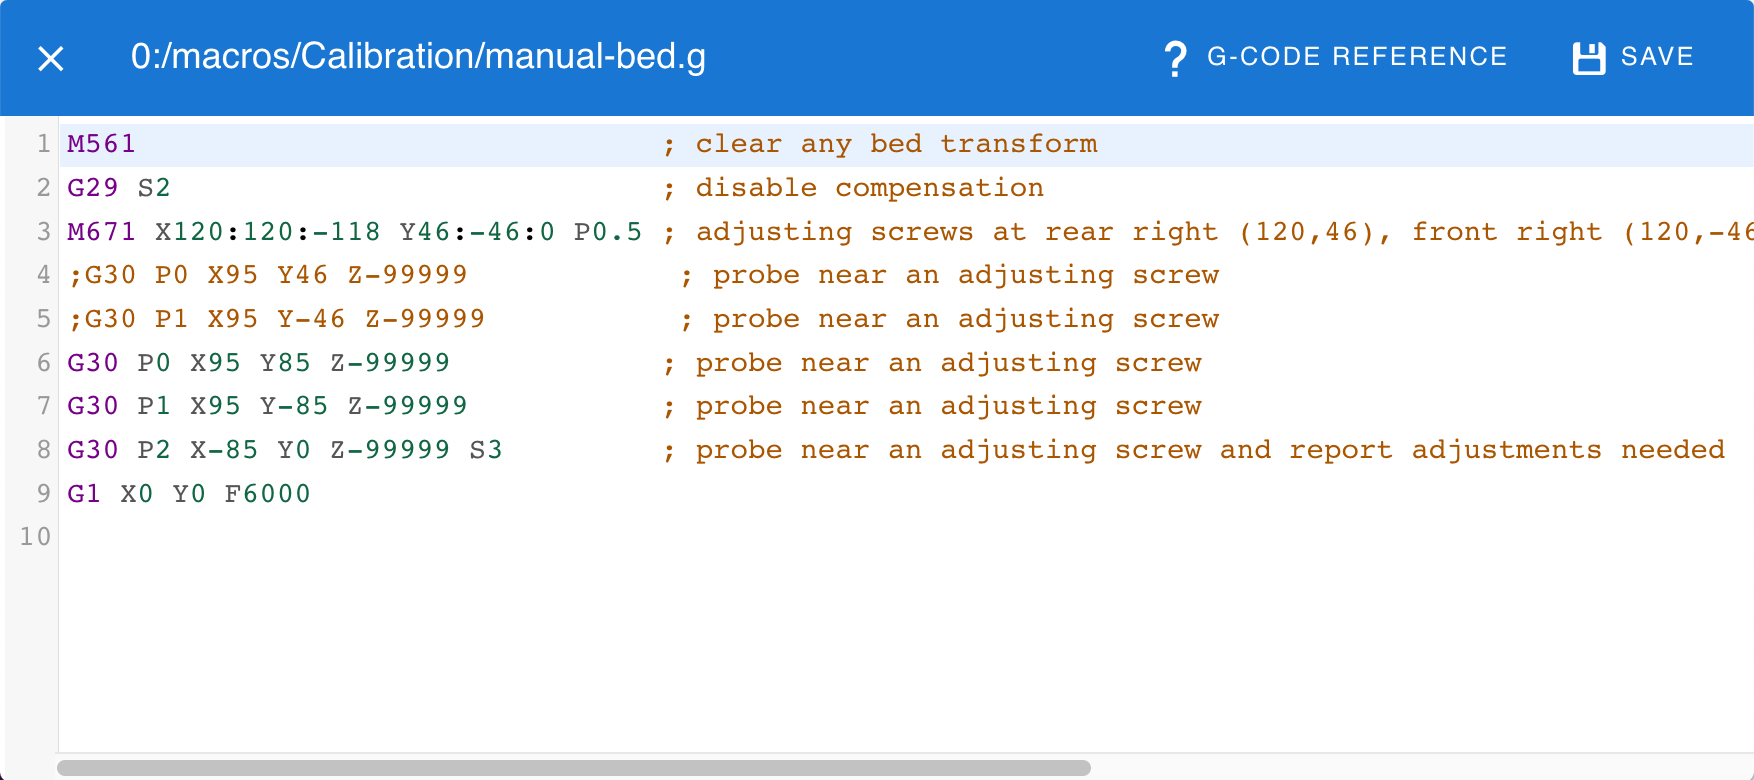
For more information and examples of macro usage, see the Macros documentation page.
¶ System
All the configuration of RepRapFirmware is carried out by GCode commands stored in specifically-named GCode files within the /sys/ directory (see SD card documentation for a description of each file). These are also known as system macros or system GCodes. The System page of Duet Web Control provides access to these, and mechanisms for updating firmware, WiFi firmware (if relevant), and the Duet Web Control software itself.
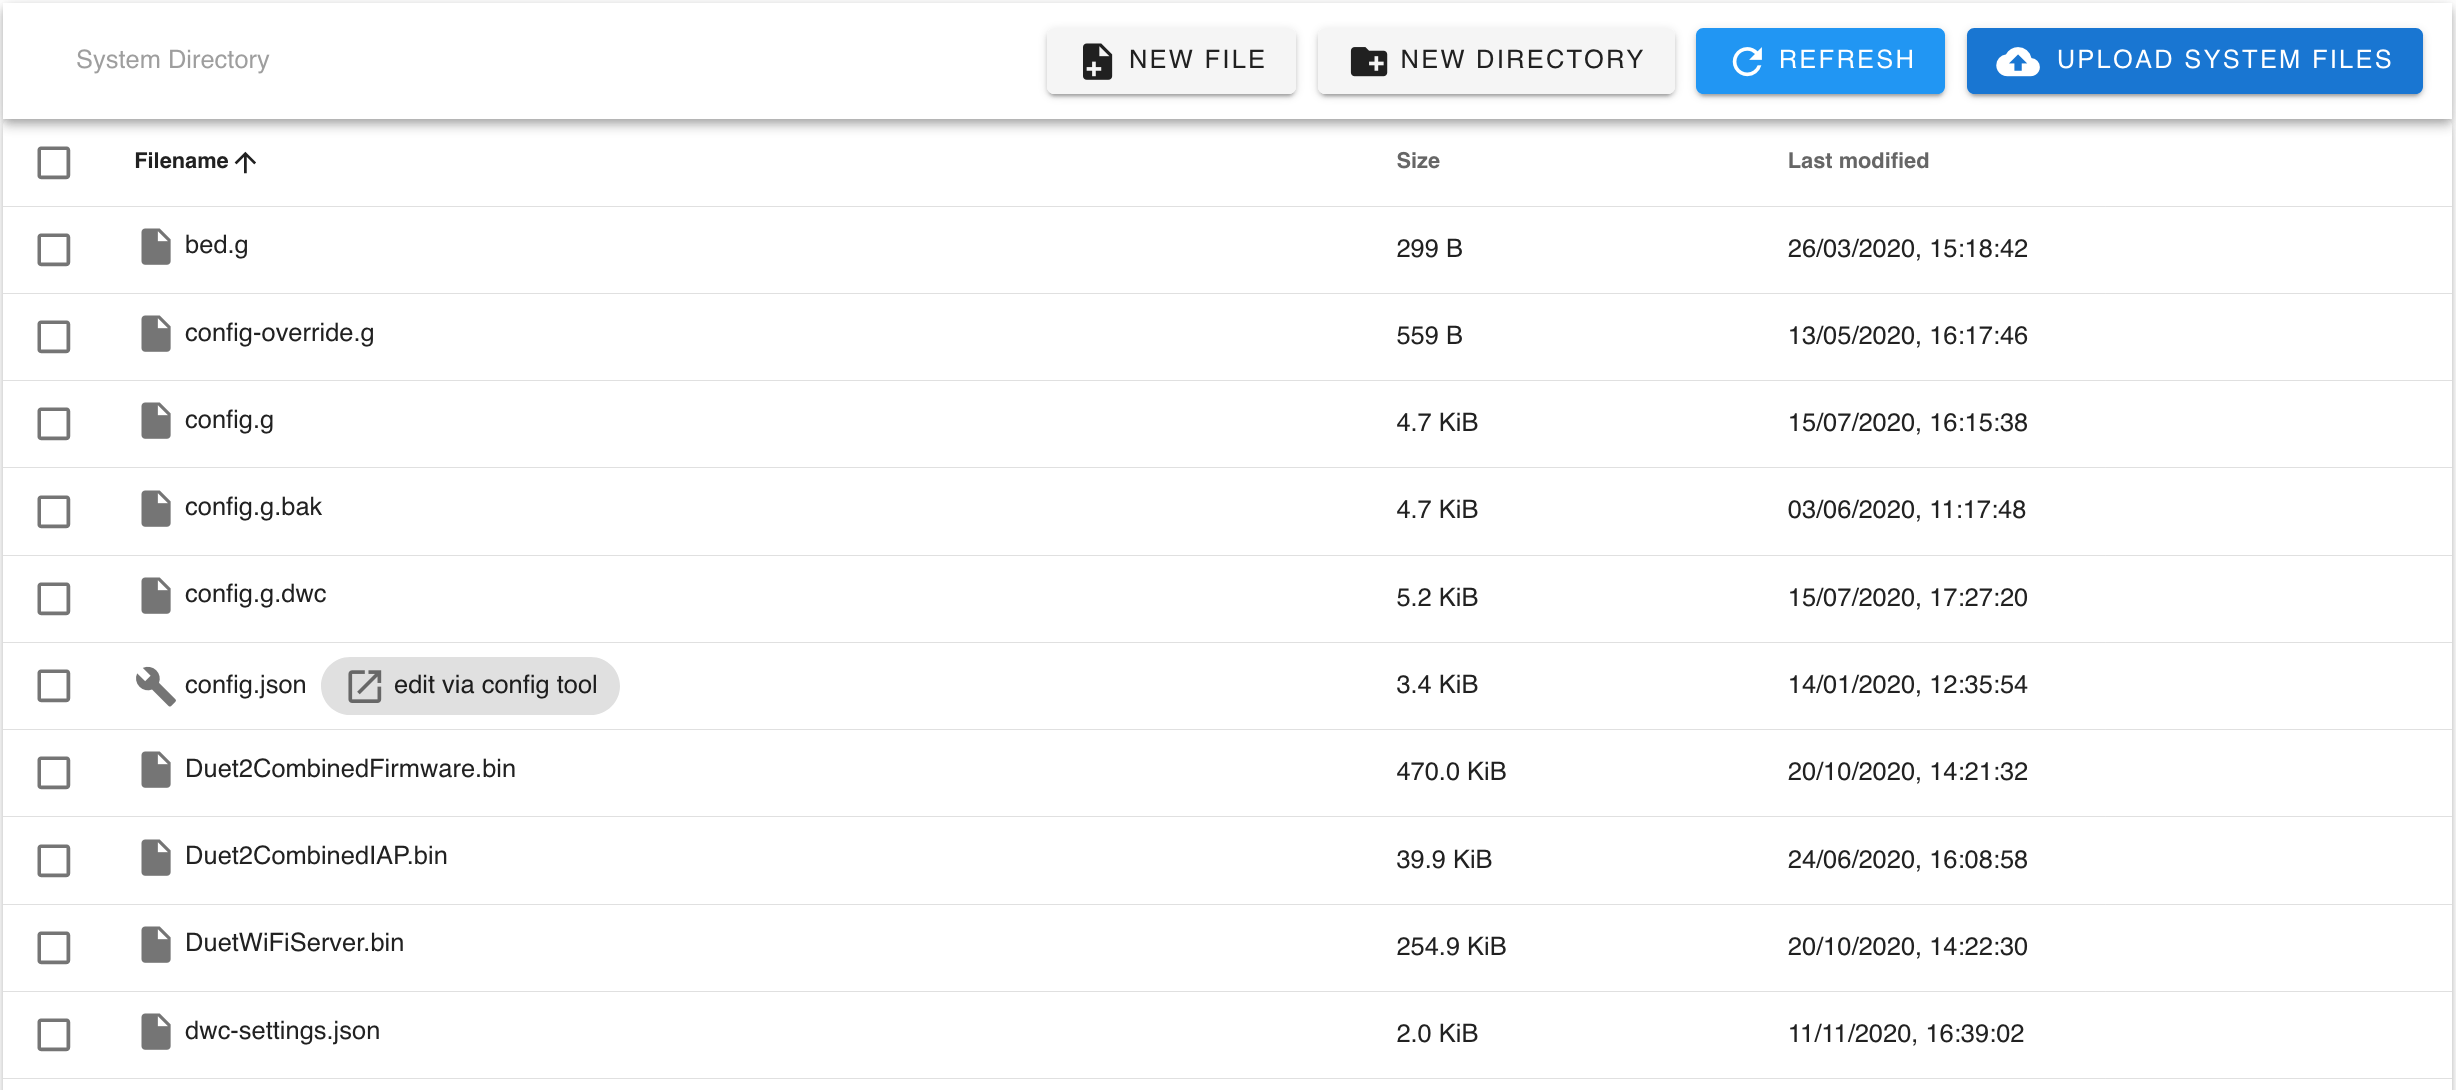
The main screen has options to create new files and directories, to organise files. Be careful moving system files around, though; the firmware expects these to be in specific places. The screen also has a button to ‘Upload System Files’. System files can be configuration packages (a ZIP file with all the configuration files in it) from the Firmware update instructions for more details.
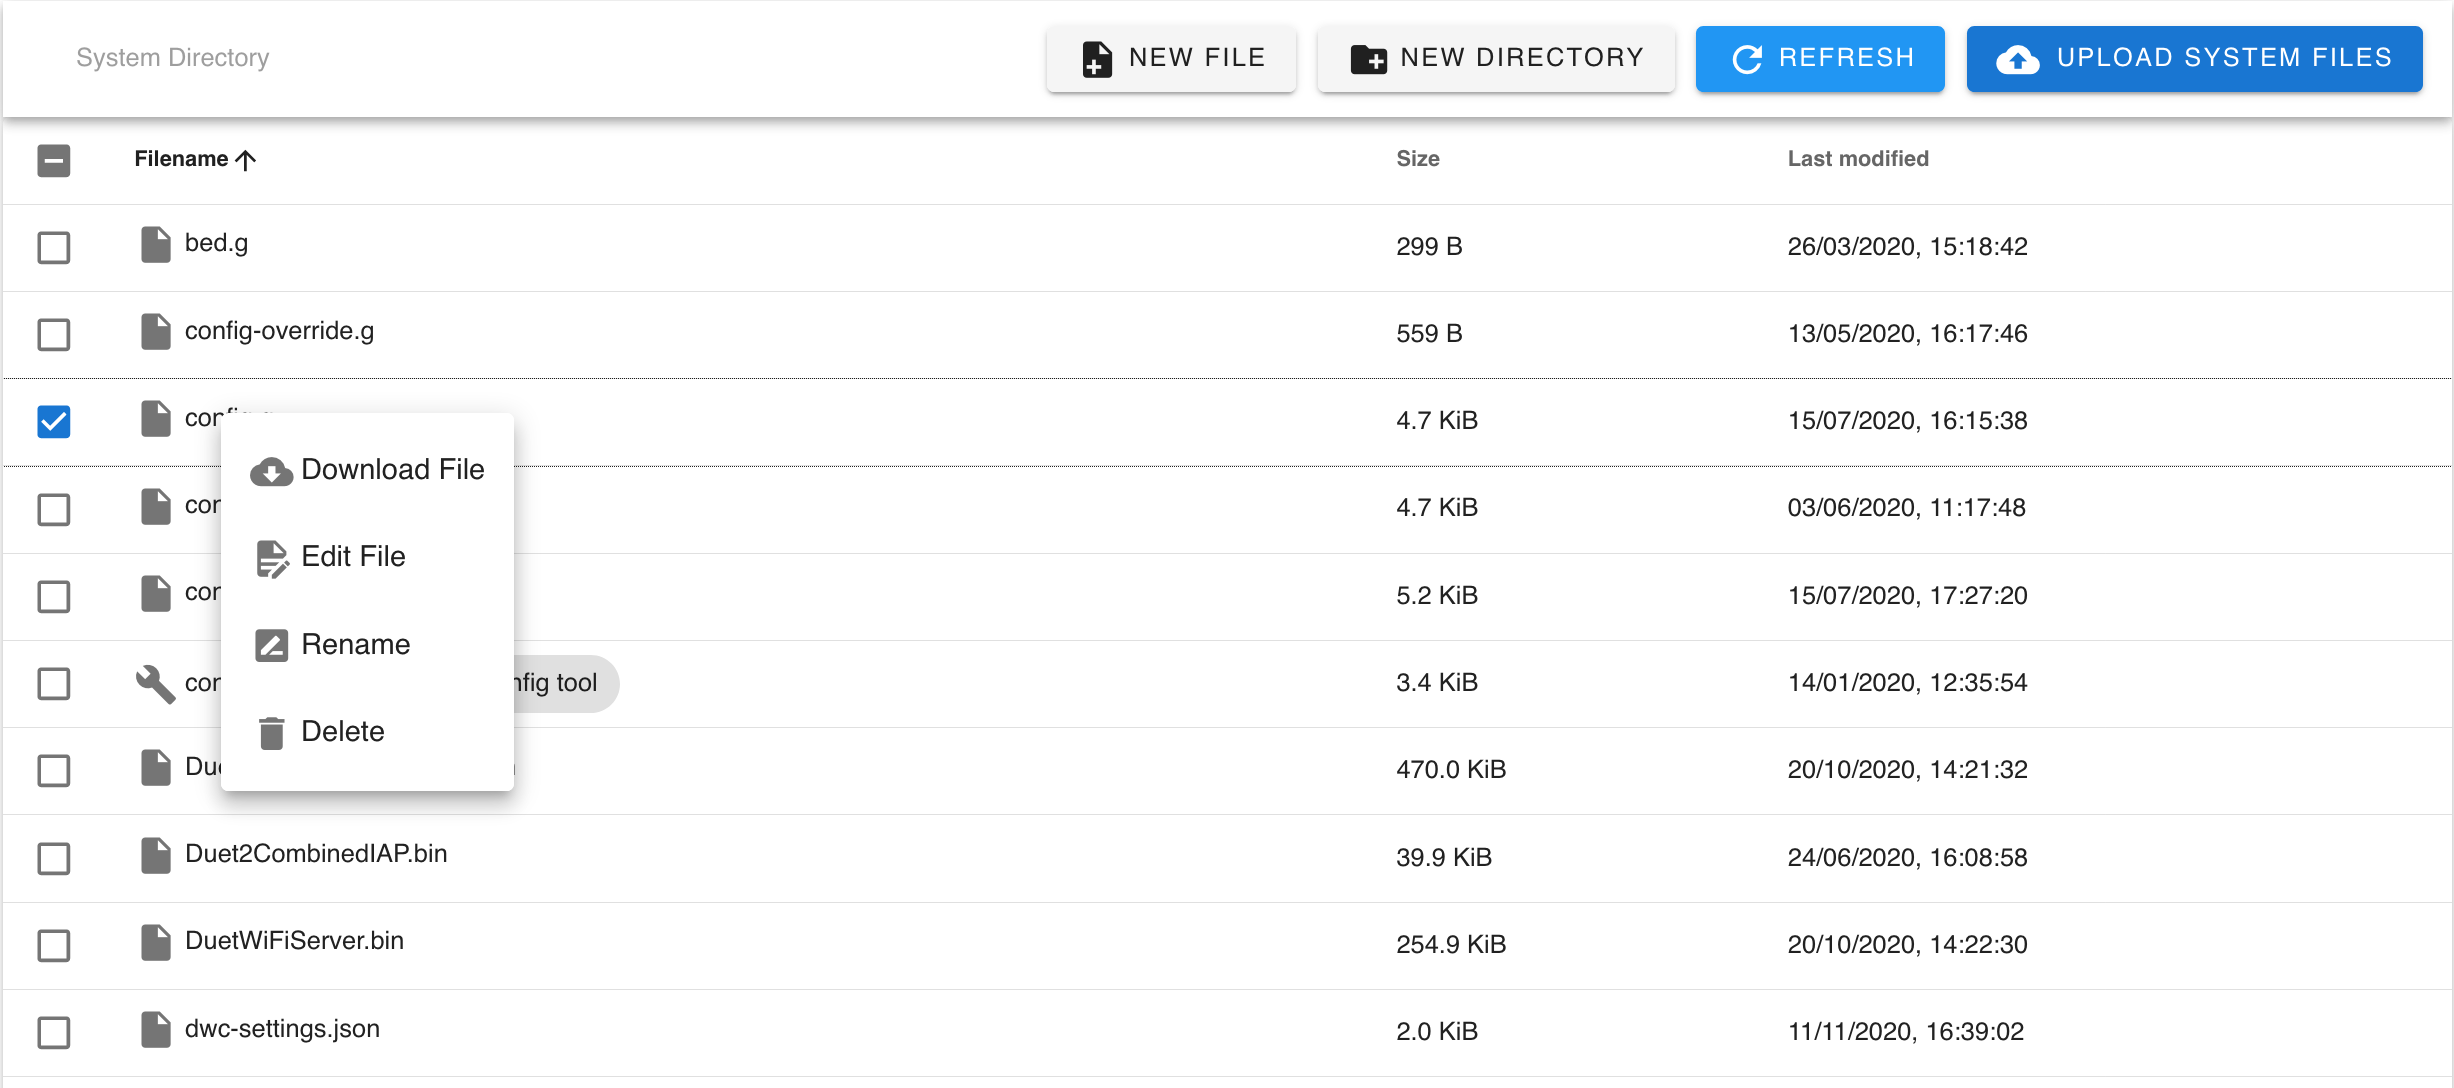
Right-clicking on files gives various options. ‘Download File’, ‘Rename’ and ‘Delete’ are self-explanatory. Files can be downloaded, edited in a text editor on your PC, then uploaded, which has the advantage of maintaining a local copy. Alternatively all the changes can be made by editing the files within the web interface by clicking ‘Edit file’, which will display the file in a text editor.
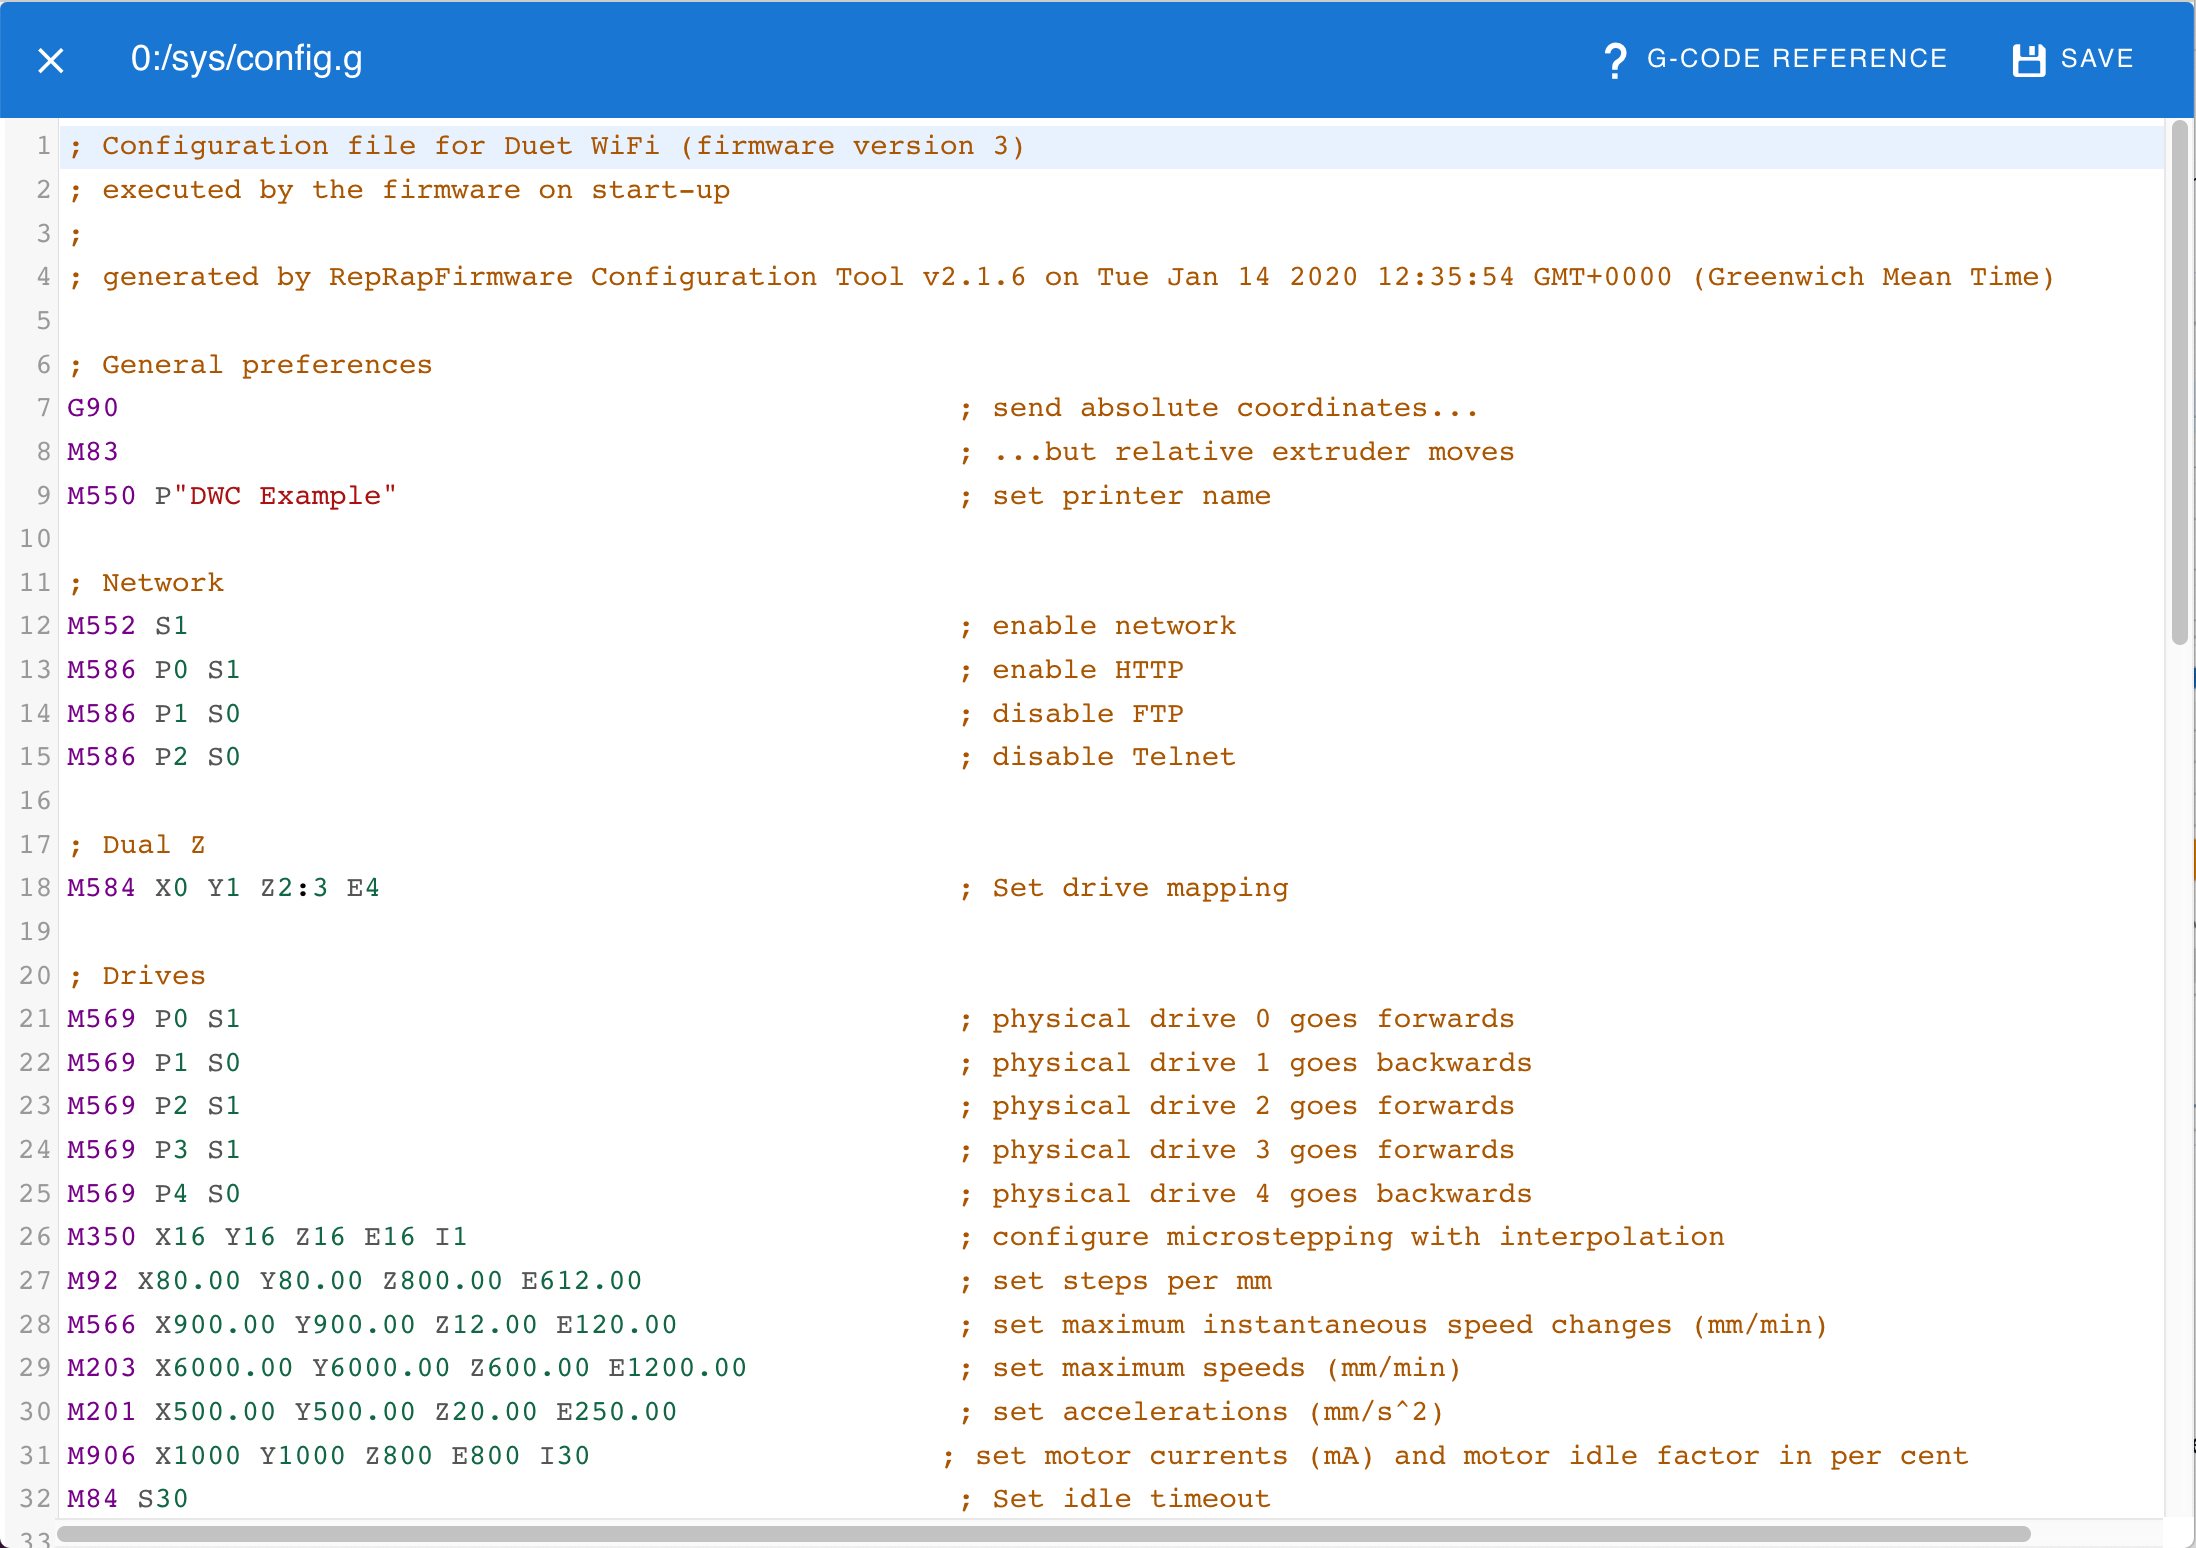
Click ‘Save’ to save changes. If you edit the config.g file, you will be prompted to reboot the Duet to use your new config.g when you save. Setting changes to config.g do not come into effect until the duet is rebooted, or you run M98 P"config.g". Changes to other system macros such as the homing, tool change, pause etc macros come into effect without rebooting as they are read every time the printer is homed, tools are changed, a print is paused etc.
The contents of the system macros is outside of the scope of this manual. There are documentation pages dedicated to the specific settings within config.g, see Firmware configuration documentation.
¶ Settings: General
¶ General tab
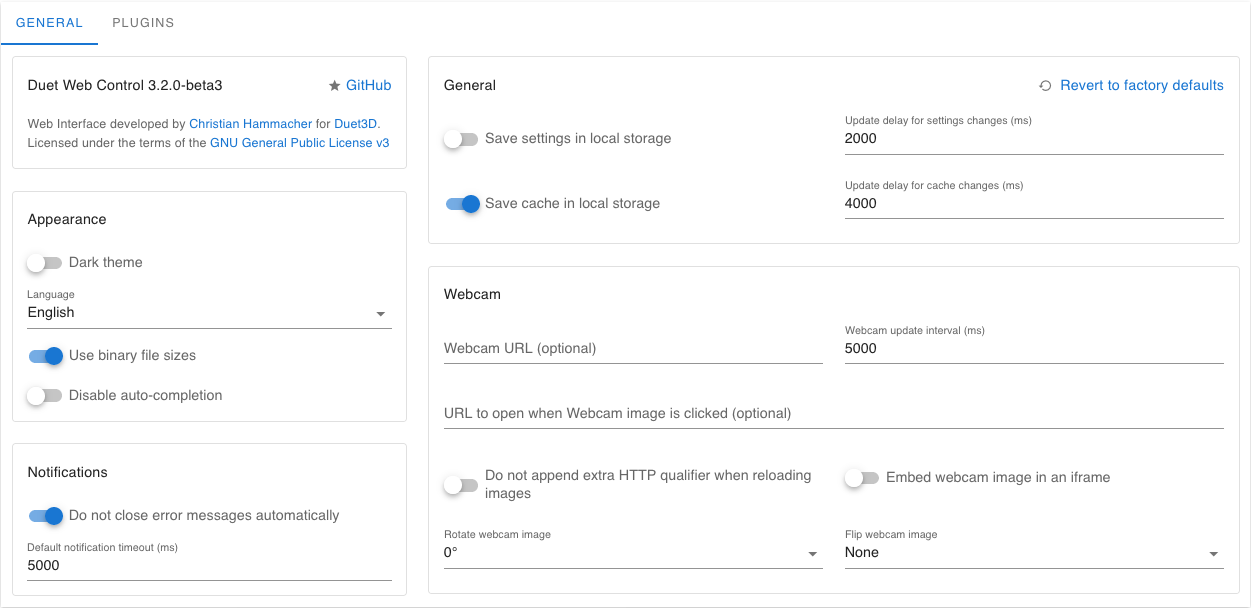
This screen shows settings for Duet Web Control’s appearance and interface, including the following:
DWC Version - useful to quote when posting a request for support on the support forum.
Appearance - Switches dark theme on/off, language, file size display and whether GCode commands auto-complete.
Notifications - Controls the display of pop-up notifications.
General - controls where and how frequently Duet Web Control settings and cache are stored.
Webcam - controls connection of a webcam. See Connecting a web camera to Duet Web Control.
¶ Plugins tab (built-in)

From Duet Web Control v3.2, functionality can be extended by installing and activating plugins. Plugins are not generally required for normal machine operation, and are disabled by default. This Plugin tab shows plugins provided with the standard Duet Web Control installation. Enabling a plugin adds a new screen option to the main menu, if relevant. You can start and stop plugins, but will generally need to refresh your browser to unload/stop a plugin completely.
¶ Settings: Machine-Specific
¶ General tab
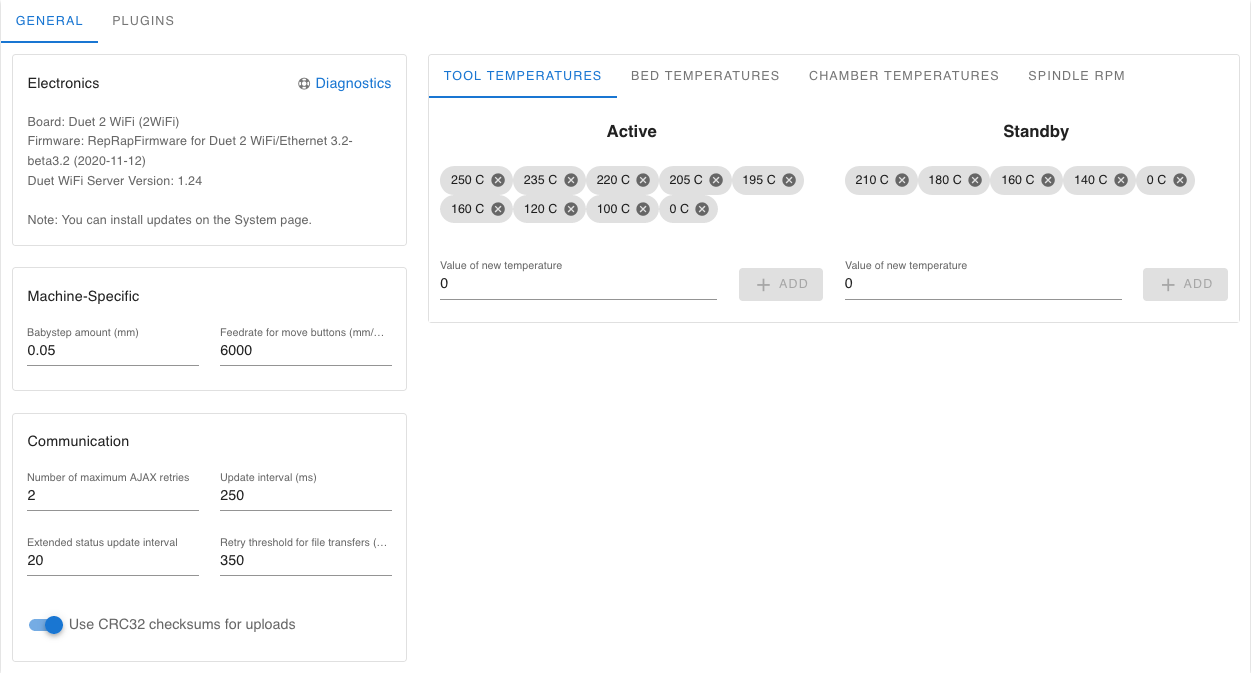
This screen shows settings that are specific for the machine, and how Duet Web Control interacts with it, including:
Electronics - useful to quote when posting a request for support on the support forum.
Machine-Specific - babystepping increment/decrement in mm, and feedrate in mm/min for all axes when pressing the move buttons on the Dashboard screen.
Communication - settings specific for data communications between DWC and Duet.
Tool/Bed/Chamber temperatures, Spindle RPM - sets values available in drop-down lists on the Dashboard screen.
¶ Plugins tab (third-party)

Third-party plugins that you have added to your machine are listed and activated/stopped/uninstalled here. Upload plugins using the ‘Upload System Files’ on the System screen. You will then be prompted if you want to install the plugin once uploading has completed. Once started, an option for the plugin will appear in the main menu, if relevant.
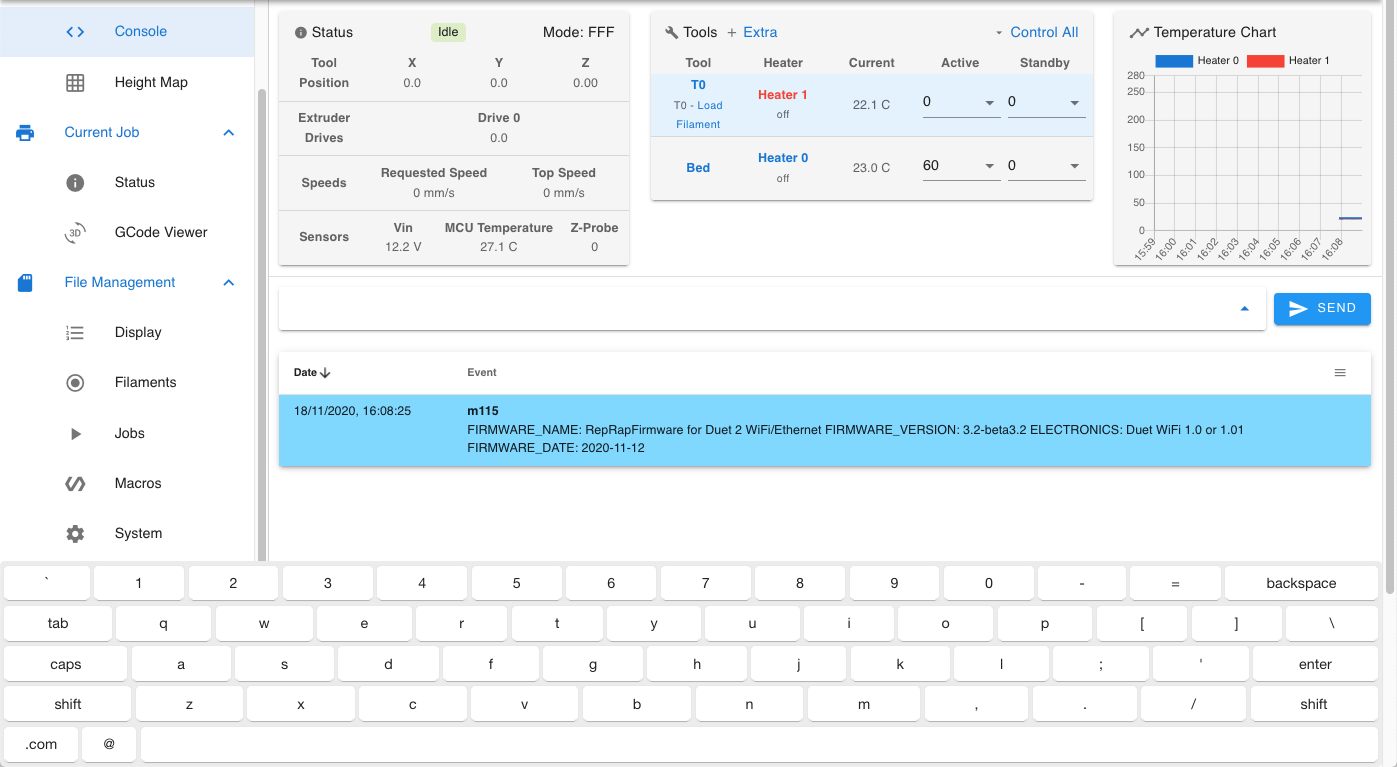
The above shows the ‘Height Map’ (built-in) and ‘GCode Viewer’ (third party) plugin menu options activated, along with the ‘On-Screen Keyboard’ (built-in) plugin (no menu option, pops up when input is required, eg on the Console screen).